


Hello Interactors,
I recently returned from an extended trip back east for a talk at Harvard University’s Graduate School of Design (GSD). I also threw in quick visits to Boston and New York to visit my kids, and then stopped over in Kansas City to visit family on the way back to Seattle.
I was invited to keynote a two-day symposium hosted by the Laboratory for Design Technologies on the role of technology in micro-mobility in urban environments. My friend and colleague, Allen Sayegh, has been tracking my work on Interplace and thought my perspective was worth sharing. I was joined by two other speakers:
Carole Turley Voulgaris, Assistant Professor of Urban Planning at the GSD. Carole focuses on explaining what influences decisions on travel through cities. She considers how transportation planning institutions utilize travel decision making to inform their plans, policies, and infrastructure design.
Bryan Boyer, cofounder of the architecture and strategic design studio Dash Marshall. Brian is also an Assistant Professor of Practice in Architecture and Director of the new Bachelor of Science in Urban Technology degree at Taubman College of Architecture and Urban Planning at the University of Michigan. He is a graduate of the GSD.
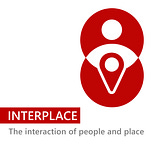
The title of my talk was a riff on one of my first essays about my time at Microsoft: A Computer on Every Desk and a Car in Every Garage: How Bill Gates and Herbert Hoover Altered How We Interact with People and Place.
It was the PC revolution that enabled virtual interaction with others around the world – all while seated behind a glass screen. Meanwhile, automobile proliferation further isolated others from their neighbors and immediate surroundings enabling a virtual interaction – all while seated behind a glass screen. Given these trends, what are the implications for land use, the built environment, and collective mental, physical, and societal health? How did we get here, and where do we want to go…today?
As interactors, you’re special individuals self-selected to be a part of an evolutionary journey. You’re also members of an attentive community so I welcome your participation.
Please leave your comments below or email me directly.
Now let’s go…
GSD, LDT, AND THE LCGSA
“Technology is accelerating profound changes throughout society, affecting everything we do — how we live, work, produce, build, and think.”
These are the words that frame Harvard University’s Graduate School of Design’s (GSD) Laboratory for Design Technologies. The GSD has a long-storied history. It was the first in the country to offer a landscape architecture class in 1893 and the first in the world to offer landscape architecture degree in 1900. The program was founded by Fredrick Law Olmsted, Jr., the son of the more famous Frederick Law Olmsted. That same year Harvard offered the country’s first urban planning courses and by 1929 expanded to become the first urban planning degree in North America.
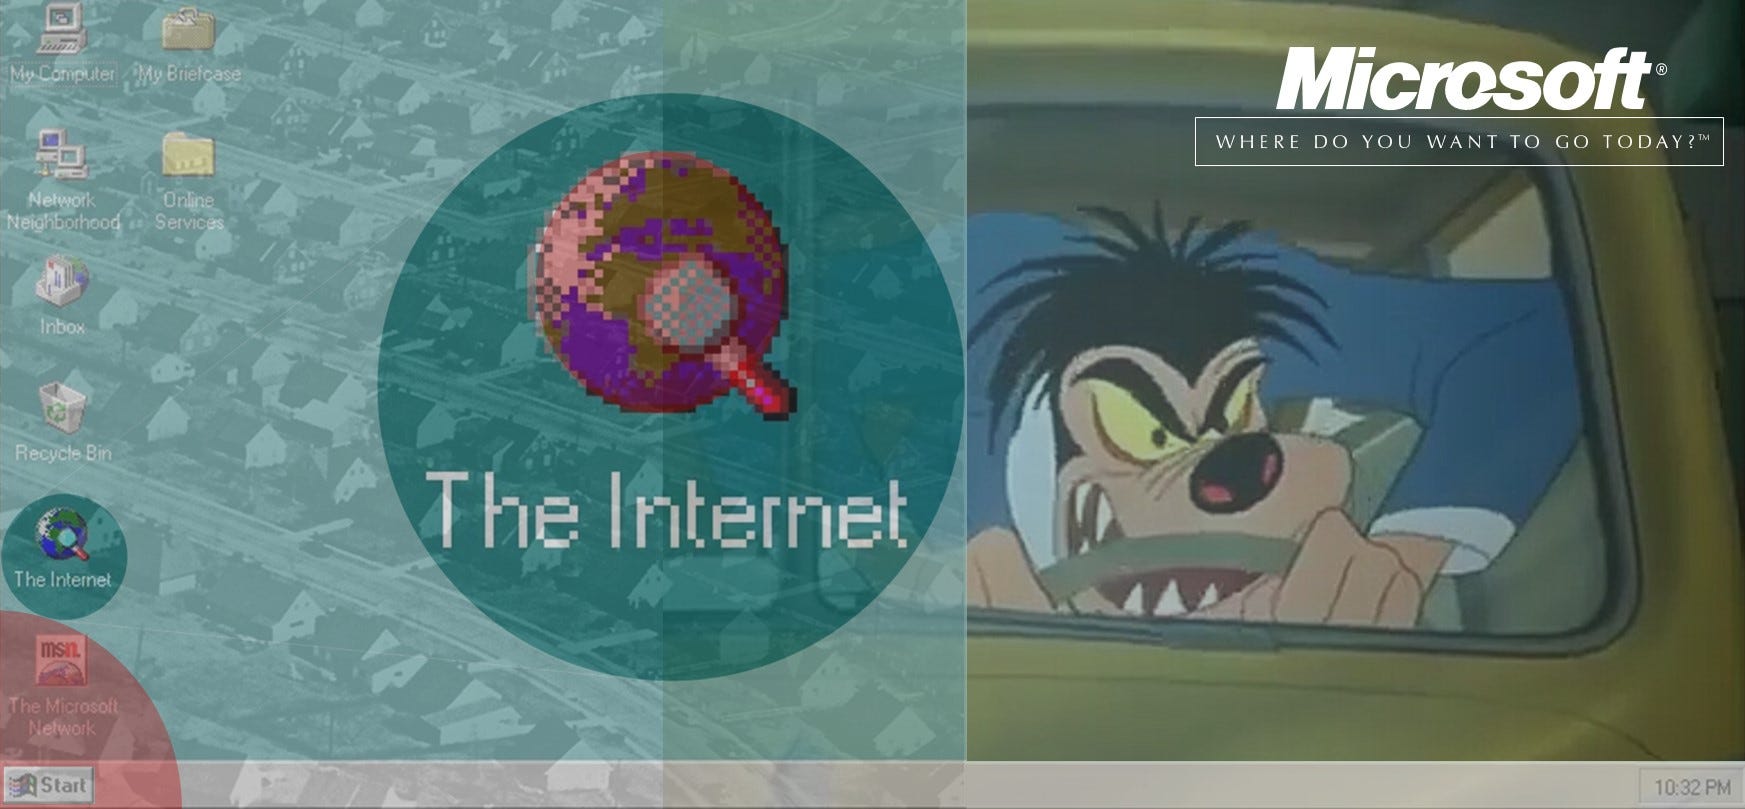
In 1936 the official Harvard Graduate School of Design was launched housing schools of architecture, urban planning, and landscape architecture. A year later, the famous modern architect Walter Gropius became faculty chair in architecture and the GSD’s reputation as a modernist powerhouse was established. In 1972 that reputation was solidified in the iconic concrete brutalist architecture of the GSD’s new home, Gund Hall.
But in the shadows of the looming starchitects climbing the stairs to the tiered terraces of sundrenched cubicles teaming with design students, was a computer lab. It was here technology minded design professors and students were incubating the foundations of software we repeatedly use everyday to find our way around the world – computer generated maps.
In 1965, the Harvard Laboratory for Computer Graphics and Spatial Analysis (LCGSA) was formed by a Harvard trained architect, Howard Fisher. He was enamored by the work of a University of Washington urban planning professor, Edgar Horwood. The University of Washington geography department had already established itself as a center of excellence in quantitative geography and computer cartography as part of geography’s quantitative revolution. Horwood’s use of computer cartography spread to Harvard, the LCGSA, and throughout the GSD for years to come.
Fisher’s program attracted grant money that helped it grow to forty researchers. In the 1970s, the Harvard administration encouraged the commercialization and licensing of research across the university. The LCGSA continued to innovate licensing software and graduating entrepreneurs that fed the infancy of Geographical Information Systems (GIS) industry and discipline of Geographical Information Science (GIScience). In 1969, one GSD landscape architecture graduate went on to create what is now the world leader in GIS software, Environmental Systems Research Institute (ESRI).
As more staff left for industry, funding also subsided. By the 1980s Harvard cooled on the commercialization of research, funding was curbed, and the GSD was encouraged by the administration to focus on pure research. The last director of LCGSA, which closed in 1991, was the late Dan Schodek.
Dan continued to provide a place for technology minded designers and directed the Laboratory for Design Technologies. I was introduced to Dan by a Microsoft colleague and GSD student in 2007 and Dan invited me to spend a year at the GSD as a visiting fellow. I traveled back to Boston regularly to explore ideas for computer interaction design curricula inside the GSD. It was there and then I was introduced to Allen Sayegh.
In the years since, Allen has turned his attention more toward my past – interaction with technologies – while I’ve turned my attention toward his past – interaction with the built environment. And it is precisely this kind of incongruent and serendipitous collaboration that keeps the GSD, and its technology lab, a fertile source of exploration and discovery. This symposium was no exception. With invited attendees from the University of Bergamo in Italy, who also study urban mobility, students and faculty spent a few days exploring the role technology plays in the built environment and the interaction of people and place.
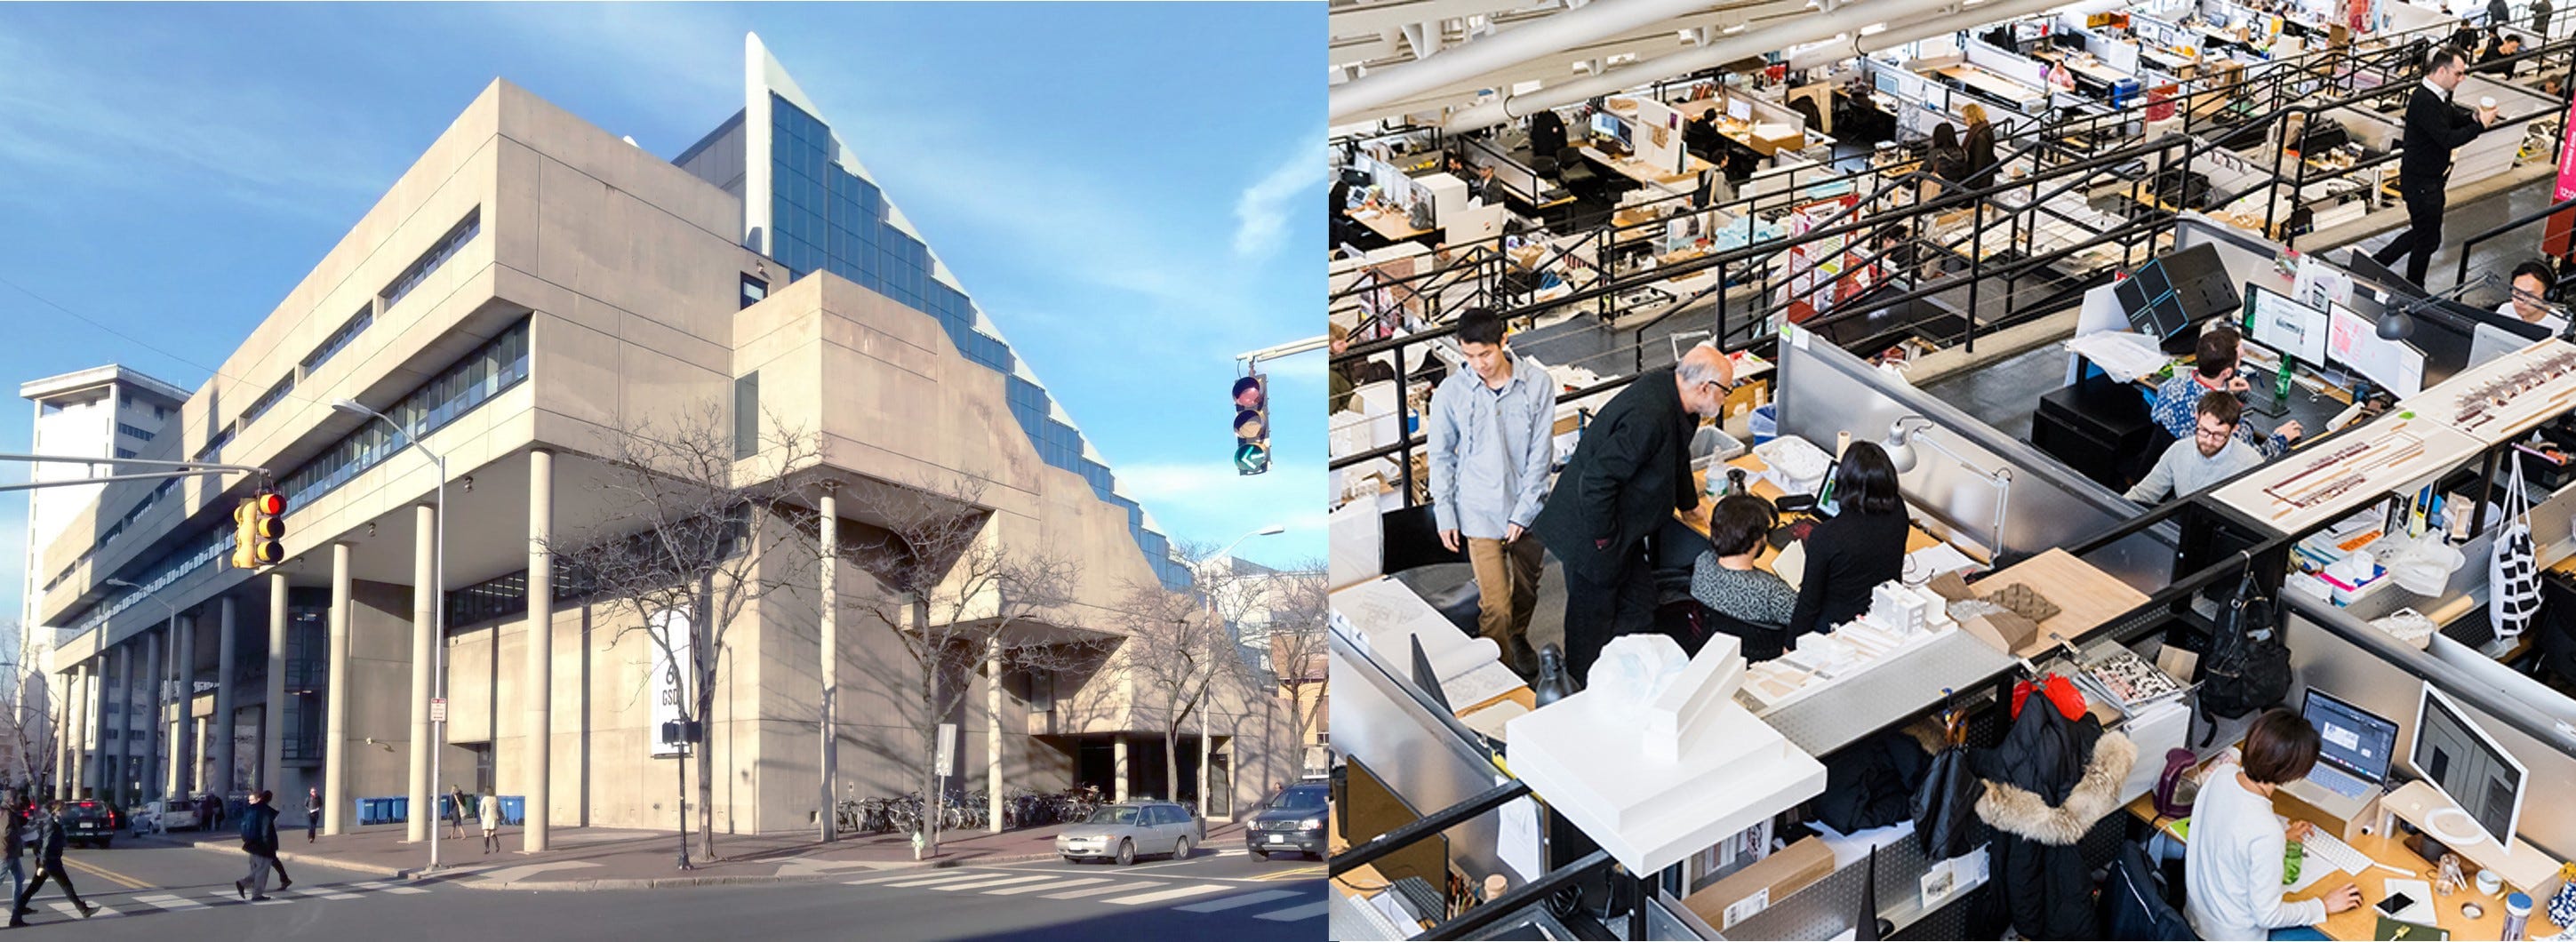
This topic is perhaps more pressing today than in human history, thanks to a worldwide pandemic and the PC revolution. In March the U.S. department of labor released their 2022 survey results on remote work. It reveals nearly seventy percent (67.2%) of information workers continue to choose to work remotely some or most of the time. This contrasts with more traditional industries that require a physical presence like those related to the built environment, including transportation (13.6%) and construction (10.5%).
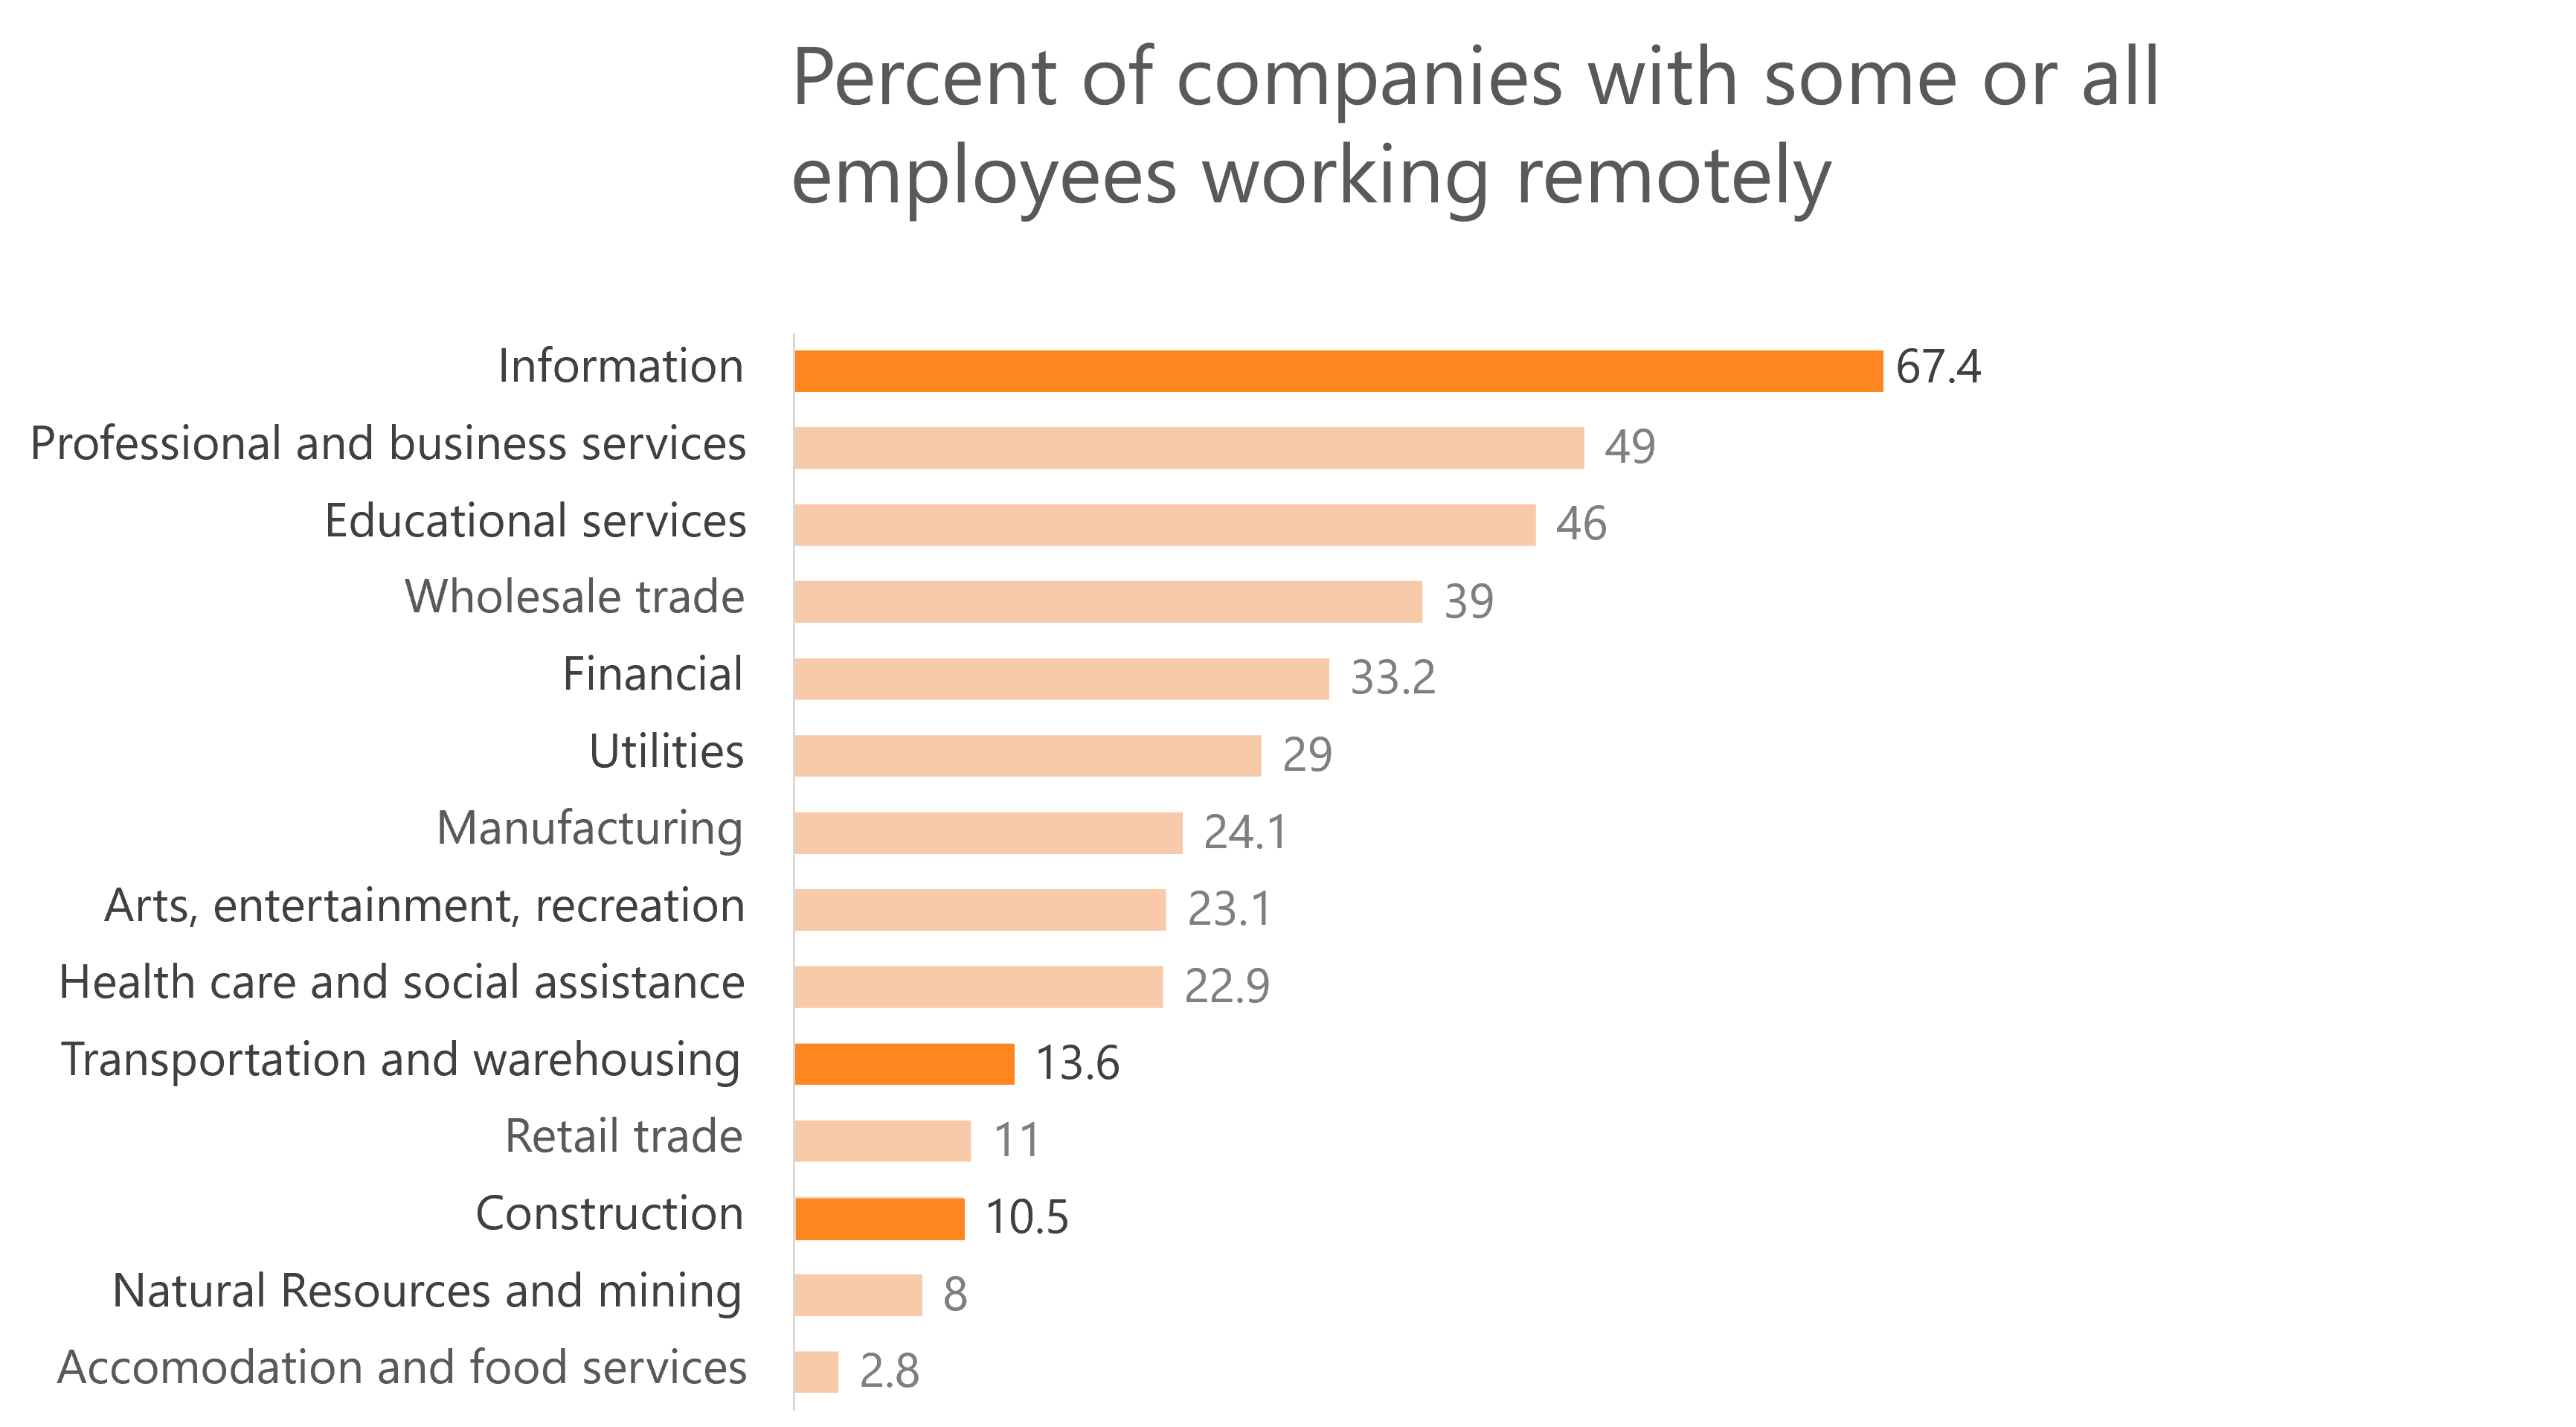
A gulf has formed between those able to chose to work in the ‘virtual’ world and those required to work in a ‘physical’ world. What does this split say about how we move and interact between and within the physical world and its occupants…or not? How will it impact how cities plan? To unravel how we got here, we should start with Bill Gates. His company, Microsoft, was the primary catalyst for enabling a new way of working and communicating on a tool many now take for granted – the PC.
When I started at Microsoft in 1992, the graphical user interface was just taking off and computers stood alone, disconnected from each other. I worked on designing micro-interactions, on micro-computers, in micro-spatial environments. It was microcomputer software, Microsoft.
Sharing information between computers required physically walking or mailing a floppy disk to another person. But that was short-lived. By the end of my first year, Windows for Workgroups released which connected computers through growing local area networks (LANs). The ‘sneaker network’ was replaced by the ‘ether network’. But this ‘virtual’ sharing of information was mostly contained within buildings and campuses. Still, Microsoft Windows enabled microcomputers to share information virtually at a microspatial scale through PCs that were growing in popularity.
USER FRIENDLY
As popular as they were, computers were still relatively hard to use. I was hired as part of a growing team of usability engineers and user interface designers tasked with making them easier. Complex software made for complex behavior, observed scientist and Nobel Prize winner Herb Simon in his quote, “The apparent complexity of our behavior over time is largely a reflection of the complexity of the environment in which we find ourselves.”
Through a bit of luck, ingenuity, and design iteration, progress on more learnable user interfaces was made. And by 1995, the advent of the ‘Start’ button in Windows ‘95, a desktop icon labeled ‘The Internet’, and software offered in many languages, Microsoft and the PC industry quickly grew globally. This growth coincided with, and was aided by, the widespread sociopolitical and economic expansion of globalism in the 1990s. Microsoft enabled and inspired people around the globe to consume, produce, and share information virtually at an historical scale. Micro-software at a macro-scale. This global reach prompted Microsoft’s ad agency, Wieden+Kennedy, to invent the Microsoft tagline, “Where do you want to go today?”
 + slogan (1994).svg")
This worldwide virtual connectivity worked in both directions. While people were connecting and collecting, Microsoft was too. For those who elected to do so, we anonymously collected software usage data from far reaches of the world. A feat unimaginable just a few years prior. We could now see what features were being used, how often buttons were clicked, and statistically model how people were interacting with our software. We paired big-data quantitative analysis through remote telemetry with high-touch qualitative analysis from on-site usability labs.
Addressing expanding markets and satisfying endless varieties of user goals, demanded more and more new features. By 1998, three years after Windows and Office 95, Microsoft software was perceived as slow and bloated with features. Recalling Herb Simon, the apparent complexity of user behavior was largely a reflection of the complexity of the software environment which we found ourselves creating. To better understand the issue, a colleague and I even sponsored a multi-day workshop at a conference that resulted in a paper paradoxically titled, “Too much of a good thing?” Customers and end-users would complain of too many features out of one side of their mouth and request three more out of the other.
In the eyes of Microsoft and its shareholders, too much was a good thing. Between 1990 and 1997 the percent of U.S. households owning computers more than doubled across all demographics. Similar growth occurred throughout other parts of the world with necessary communication infrastructure and wealth. It took 25 years for Bill to achieve his domineering capitalistic dream of ‘a computer on every desk and in every home.’ The PC had become a household appliance and Microsoft a household name. The world would never be the same again.
Meanwhile, another successful vision of economic and product domination was already over 75 years old and was sweeping the country and parts of the world. In I928, future U.S. president Herbert Hoover, and the Republican party, ran on this campaign promise – ‘a chicken in every pot and a car in the garage.’ That promise led to a flood of automobiles that reshaped our land, our behavior, and our society – including how we interact with people and place. The world would never be the same again.
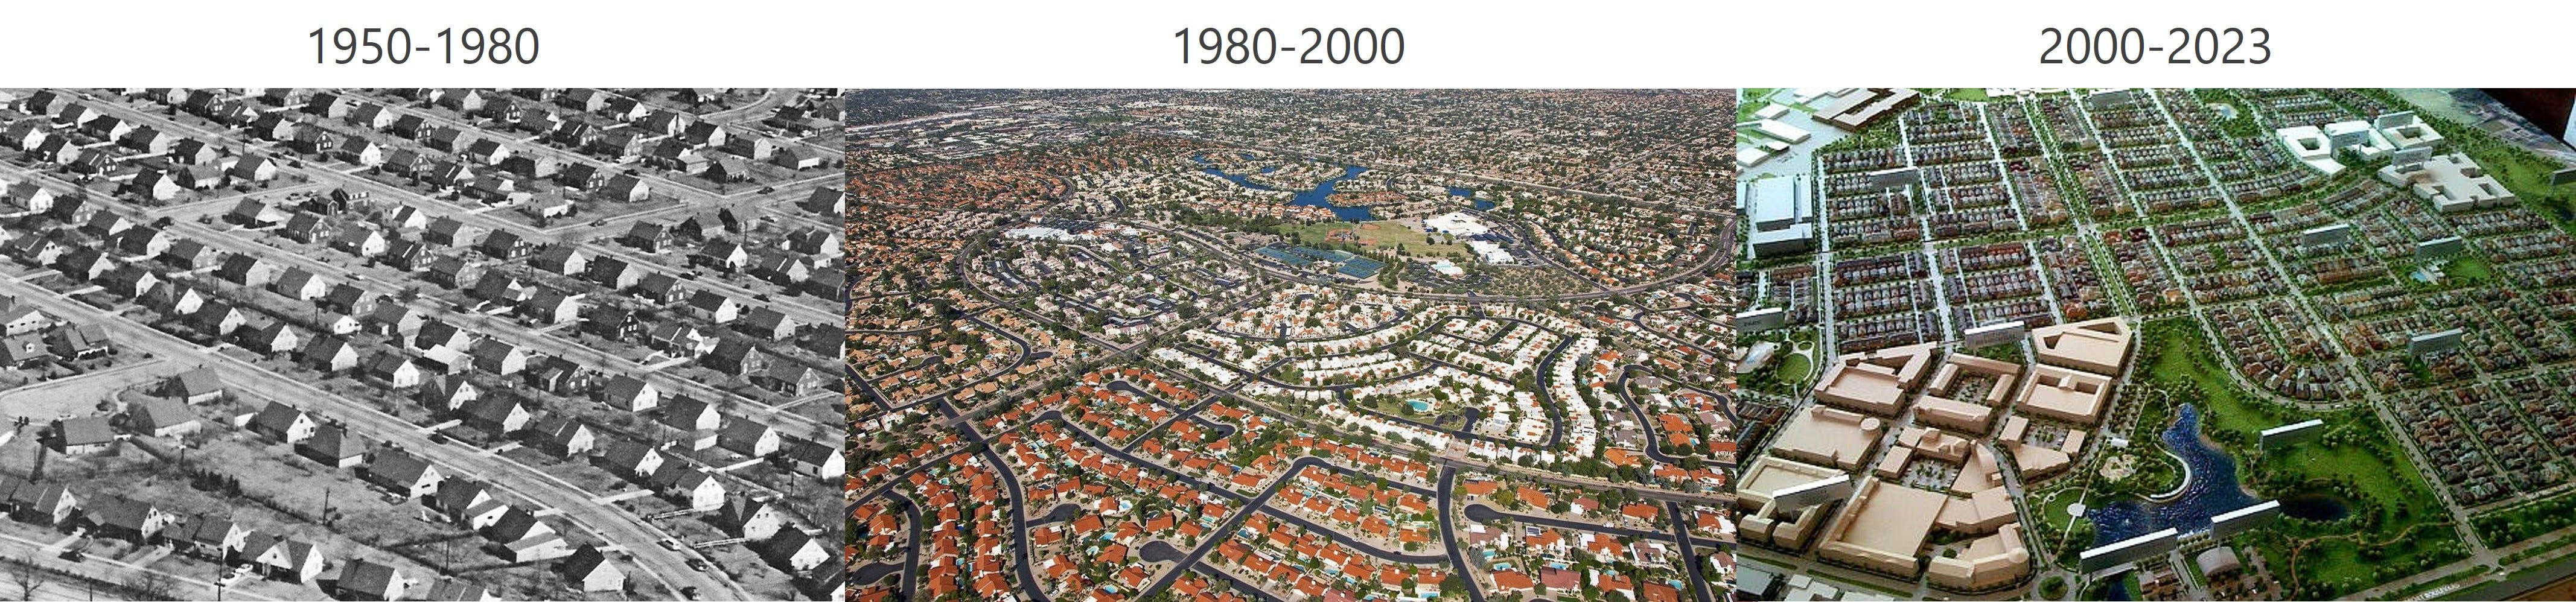
Transportation and how we use land are trapped in a perverse self-supporting spiraling circularity from the center outward. As urban populations grow, housing creeps to the fringes of the city center. This spawn’s transportation needs to further away places where more development welcomes new homes and businesses. These new developments require even more transportation which in-turn attracts more growth. More growth requires more transportation. It’s a cycle that leads to sprawling urban metropolises and leap frog developments.
America is known for its sprawling metropolitan areas, but Europe sprawls too. While 75% of Europeans live in dense urban areas, satellite imagery reveals many of their cities also creep and leap.1 Paris is currently the darling of championing a more walkable and bikeable “15-minute city”, but just beyond the urban core are the same car dependent suburbs you find in America.2 Sprawl exists around the world. Many factors play into the self-perpetuated circular calculus of sprawl, but it’s broadly a function of income, population, agricultural land value, transportation costs, other socio−economic factors, and climatic and geographic realities.
Attempts have been made over centuries to address sprawl with movements like ‘New Urbanism’. We have ‘new’ urbanism circa 1950s to the 1980s, ‘new’ urbanism of the 1990s to 2000s, and ‘new’ urbanism of today. One could argue that even the walled cities of ancient Mesopotamian, Greek, Chinese, and American civilizations were also deemed ‘new’ forms of urbanism. We humans seem to always be struggling with needing more space while wanting less sprawl. Bloat. Too much of a good thing?
IMAGINING CITIES
City planners, managers, and policy makers have long rationalize planning schemes through quantitative reasoning. For example, in more modern times, beginning in 1826, Johann Heinrich von Thünen devised a model for urban planning in his book The Isolated State. With the city center as the middle of a bullseye, he articulated rings of land use for optimal agrarian economic development. The first ring was reserved for those items that may spoil the fastest or had the highest need, like dairy and market goods. Then came the forest for fuel, grains and crops, ranching, and finally ‘wilderness’…aka, optimal land for new urbanist sprawl.

This model was improved upon by Walter Christaller and his Central Place Theory in 1933. I recently wrote about how his theory now has some empirical validity with the Universal Visitation Law of Human Mobility which states the frequency of visits to a location is inversely proportional to their distance.
Top down, economic spatial reasoning remains the dominant method of urban planning to this day. And while it’s served the economy well, it hasn’t necessarily served humanity all that well. One notable critic of this style of planning was urban planner and author Kevin Lynch. Lynch was interested less in the top-down, God-like, cartesian, cartographic image of a city. He advocated for leveraging the mental maps people had of their surroundings. His popular book, Image of the City, included maps of the Boston area derived from the mental maps of area residents.
Another popular and influential critic of traditional urban planning was urban activist and author, Jane Jacobs. She was a voice of the people – the occupants, users, and shapers of urban spaces. In her 1961 book, The Death and Life of Great American Cities, she wrote,
“There is no logic that can be superimposed on the city; people make it, and it is to them, not buildings, that we must fit our plans.”
She frequently spoke out against the patriarchal, top-down, carving up of cities like a monopoly board. And yet, here we are, still playing monopoly on a board carved with lines optimized for the flow of money, private wealth accumulation, and the moving and parking of cars. It’s a game that results in players stuck in traffic, often in their car, waiting their turn, with this question in their mind – “Is this where I want to go today?”
Sitting in that car, moving in physical space, motorists are increasingly digitally connected to a virtual world out there – just beyond the glass of their automobile. Many of them just came from sitting at a desk digitally connected to a virtual world out there – just beyond the glass of their computer.
Embedded in our cities is the digital promise of the Internet of Things, Smart Cities, autonomous driving, and the pervasive, embedded, ubiquitous technology that has turned the automobile into a PC on wheels. And just as with software, a reciprocal relationship occurs. All those connected sensors embedded in the urban fabric, in our phones, and in automobiles make it possible to instrument and monitor how we interact with people and place.
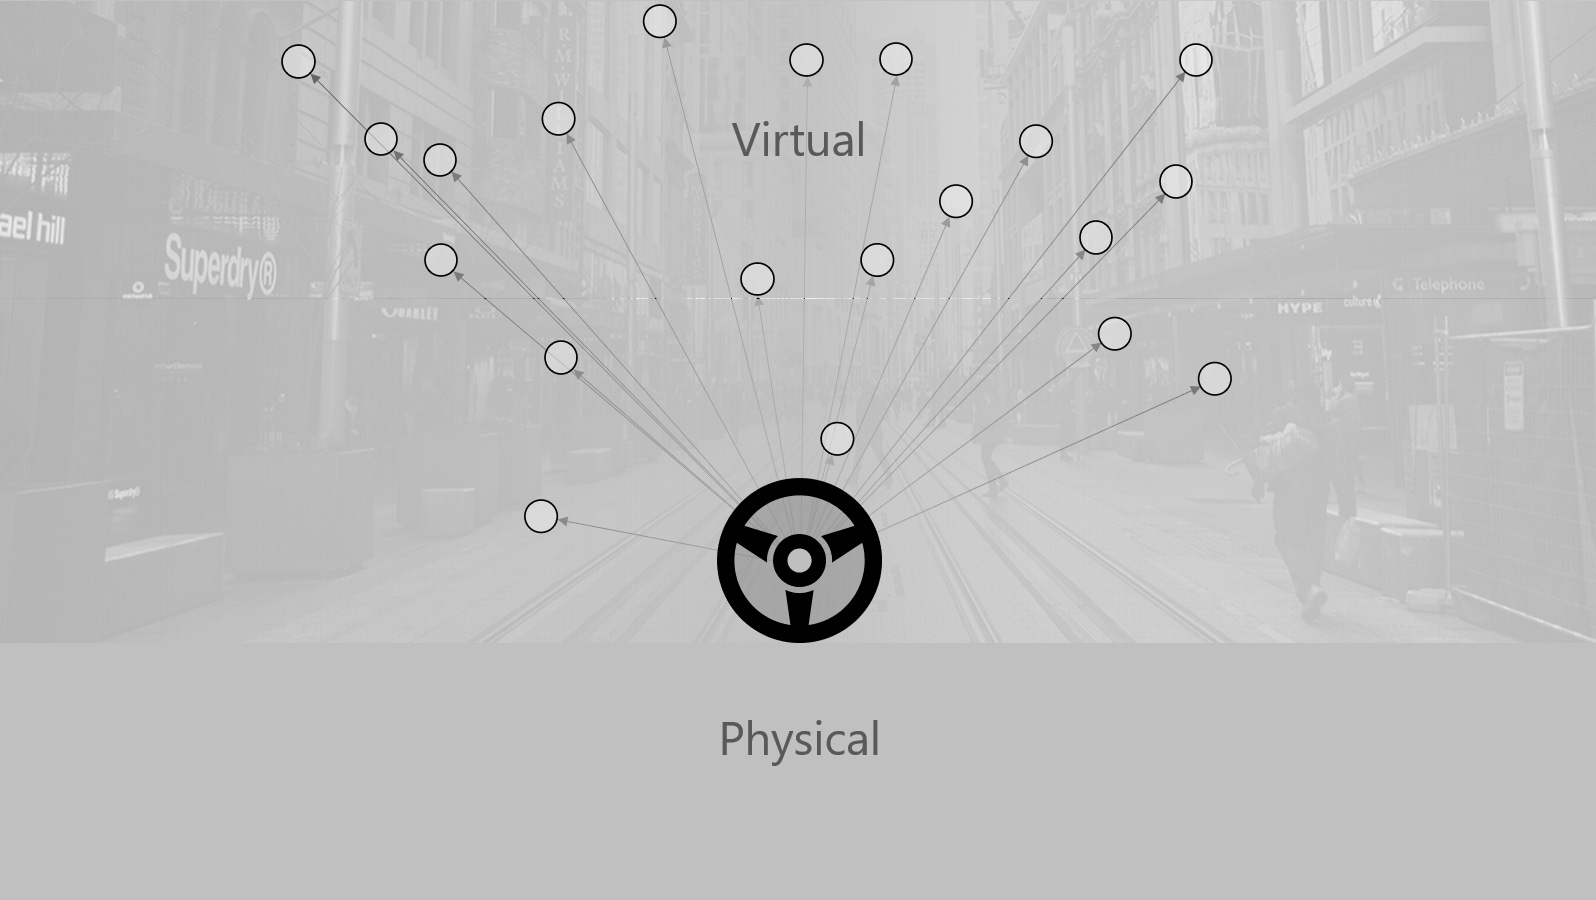
It’s this very capability that enabled those scientists to turn Christaller’s theory into power law through anonymized mobile phone data. But at what price? Both sitting at a PC and sitting in a car, humans are trapped in a physical bubble. The world is virtually available to them at an arms length distance to a mouse, keyboard, and computer screen or a steering wheel, dashboard, and windscreen. All while being inaccessible to the real world. Interactions are relayed through metal, plastic, glass, and silicon that virtually connect us to faraway people and places around the world on a PC, while physically separating us from our family, friends, neighbors, and neighborhoods in a car.
It's also led to a digital divide. An estimated 90% of high-income earners in the world have accessed the internet in the last three months versus 20% of low-income earners. If wealth attracts, encourages, and perpetuates car and digital dependency that in-turn is shaping the form of our cities, what impact does this have on societies? It’s impossible to predict, but this much we do know: The apparent complexity of our environment is largely a reflection of the environment we find ourselves in. That environment has grown in complexity, and so has our behavior. What emerges next depends, in part, on how each of us answer these questions: Where do I want to go today, how will I get there, what choice do I have, and who is most impacted?
Determinants of urban sprawl in European cities. Walid Oueslati, et al. 2015.
In 2020 Yves Crozet of the University of Lyon shared 2018 data that showed of the 12 million trips he studied in the Paris metropolitan area, 8.5 million of those were trips by car from the city core to surrounding fringe neighborhoods. While transit use is increasing in the core, there were still 14.5 million trips by car and 9.3 million by public transit.


Share this post