


Hello Interactors,
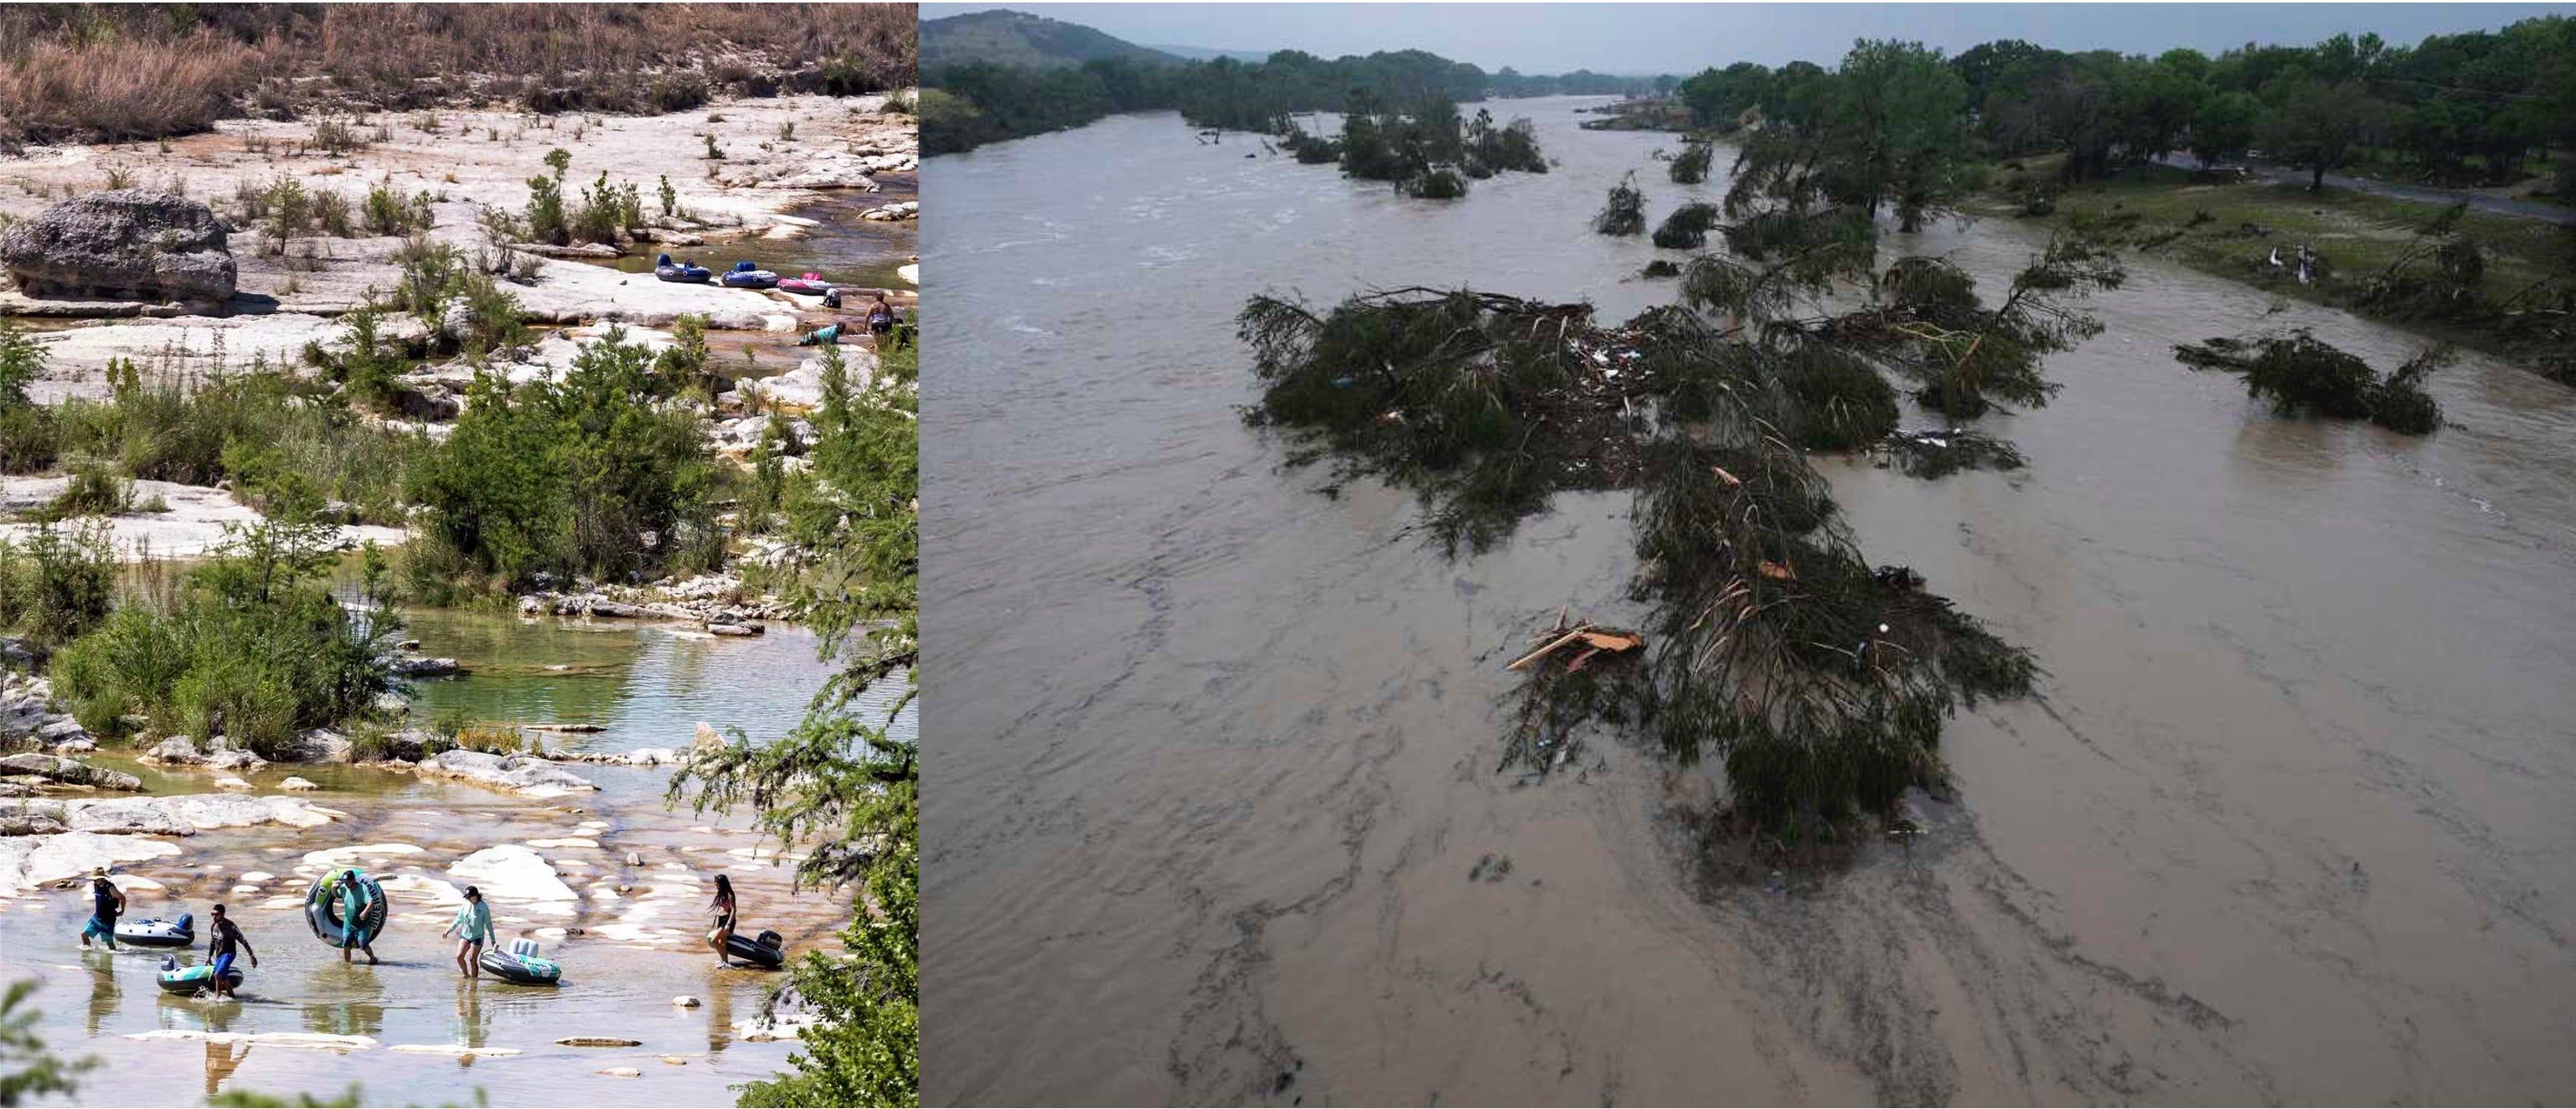
It’s hard to ignore the situation in Texas, especially as I turn my attention to physical geography. 'Flash Flood Alley', as it’s called by hydrologists, had already been pounded by days of relentless rain, soaking the soil and swelling the rivers. It left the region teetering on the edge of catastrophe. Then came the deluge. A torrent so sudden and intense it dumped a month’s worth of rain in under an hour. Roads turned to rivers. Homes were lost. Lives were too. As the floodwaters recede, what remains isn’t just devastation — it’s a lesson. One about a changing water cycle, a shifting climate, and a stubborn way of thinking that still dominates how we plan for both.

DROUGHT AND DELUGE
Is Texas drowning due to climate change? Just three years ago, we were told it’s drying up. That’s when a record drought emptied reservoirs and threw aquifers into steep decline. From 2011 to 2015, 90% of the state was in extreme drought. This seesaw between soaked and scorched is the kind of muddled messaging that lets climate deniers laugh all the way to the comment section.
The truth is Texas is drying up AND drowning.
This paradox isn’t just Texas-sized — it’s systemic. Our habit of translating global climate shifts into local weather soundbites is failing us.
According to hydrologist Benjamin Zaitchik and colleagues, writing in Nature Water in 2023, two dominant narratives frame how these events are explained.1 Public and policy reporting on patterns like those in Texas usually falls into two camps:
The "Wet-Get-Wetter, Dry-Get-Drier" (WWDD) hypothesis — climate change intensifies existing hydrological patterns, bringing more rain to wet regions and more drought to dry ones.
The "Global Aridification" (GA) hypothesis — warming increases the atmosphere's "thirst," drying out land even where rainfall remains steady.
Both frameworks can explain real conditions, but the recent Texas floods expose their limits. If a region long seen as drying can also produce one of the most intense floods in U.S. history, are these ideas flawed — or just too rigidly applied?
WWDD and GA aren’t competing truths. They’re partial heuristics for a nonlinear, complex water system. Yet our brains favor recent events, confirm existing beliefs, and crave simple answers. So we latch onto one model or the other. But these simplified labels often ignore scale, context, and the right metrics. Is a region drying or wetting based on annual rainfall? Soil moisture? Streamflow? Urbanization? Atmospheric demand?
Texas — with its sprawling cities, irrigated farms, and dramatic east–west gradient in rainfall and vegetation — resists binary climate narratives. One year it exemplifies GA, with depleted aquifers and parched soil. The next, like now, it fits WWDD, as Tropical Storm Barry — arriving after days of relentless rainfall — stalled over saturated land, unleashing a torrent so fierce it overwhelmed the landscape.
Zaitchik and his team call for a clarification approach. Instead of umbrella labels, we should specify which variables and timeframes are shifting. A place can be parched, pummeled, and primed to flood — sometimes all in the same season. And those shifting moods in the water set the stage for something deeper — a mathematical reckoning.
MATH MEETS MAYHEM
This debate boils down to three basic equations — one for the land, one for the sky, and one for how the system changes over time. But that means prying open the black box of math symbols still treated like sacred script by academics and STEM pros.
Let’s be clear, these equations aren’t spells. They’re just shorthand — like a recipe or a flowchart. The symbols may look like hieroglyphs, but they describe familiar things.
Precipitation falls (P). Water evaporates or gets sucked up by plants — evapotranspiration (E). Some runs off (R). Some sinks in (S). Time (t) tells us when it’s happening. The 'd' in dS and dt just means "change in" — how much storage (S) increases or decreases over time (t). The Greek letters — ∇ (nabla) and δ (delta) — simply mean change, across space and time. If you can track a bank account, you can follow these equations. And if you’ve ever watched a lawn flood after a storm, you’ve seen them in action.

You don’t need a PhD to understand water, just a willingness to see through the symbols.
LAND: The Water Balance Equation
P − E = R + dS/dt
Precipitation (P) minus evapotranspiration (E) equals runoff (R) plus the change in stored water (dS/dt).SKY: The Vapor Flux Equation
P − E = ∇ ∙ Q
This links land and atmosphere. ∇ (nabla) tracks change across space, and Q is vapor flux — the amount of moisture moving through the atmosphere from one place to another, carried by winds and shaped by pressure systems. The dot product (∙) measures how much of that vapor is moving into or out of an area. So ∇ ∙ Q shows whether moist air is converging (piling up to cause rain) or diverging (pulling apart and drying).SYSTEM: The Change Equation
δ(∇ ∙ Q) = δ(P − E) = δ(R + dS/dt)
This shows how if vapor movement in the sky changes (δ(∇ ∙ Q)), it leads to changes in net water input at the surface (δ(P − E)), which in turn changes the balance of runoff and stored water on land (δ(R + dS/dt)). It’s a cascading chain where shifts in the atmosphere ripple through the landscape and alter the system itself.
In a stable climate, these variables stay in sync. But warming disrupts that balance. More heat means more atmospheric moisture (E), and altered winds move vapor differently (∇ ∙ Q). The math still balances — but now yields volatility: floods, droughts, and depleted storage despite “normal” rainfall. The equations haven’t changed. The system has.
Texas fits this emerging pattern:
Rainfall extremes are up: NOAA shows 1-in-100-year storms are now more frequent, especially in Central and East Texas.2
Soil and streamflow are less reliable: NASA and USGS report more zero-flow days, earlier spring peaks, and deeper summer dry-outs.34
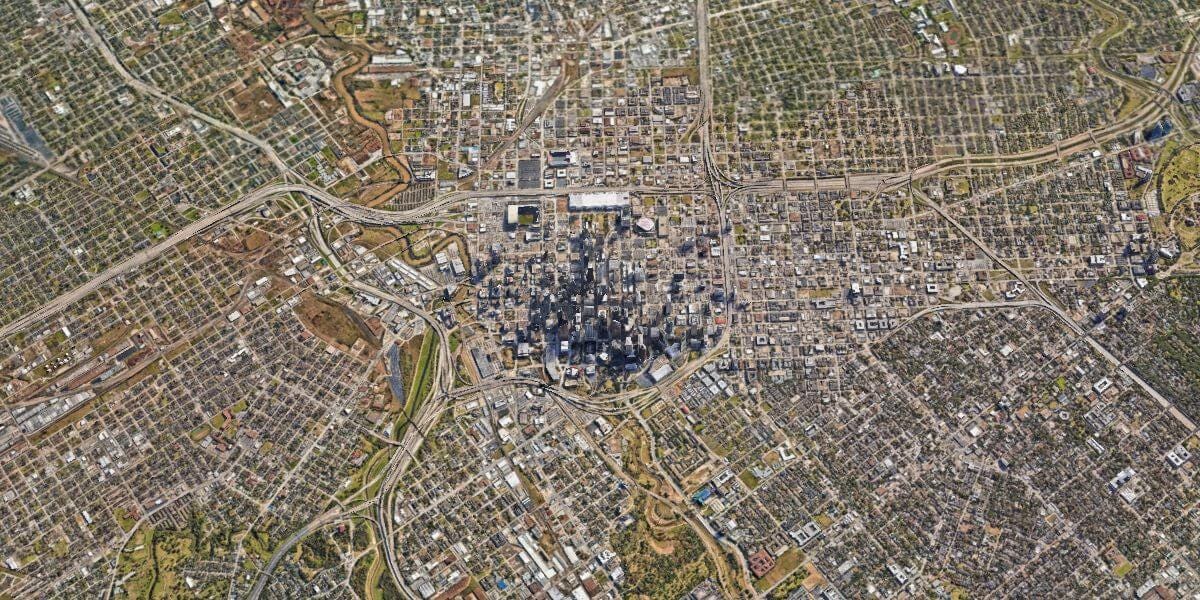
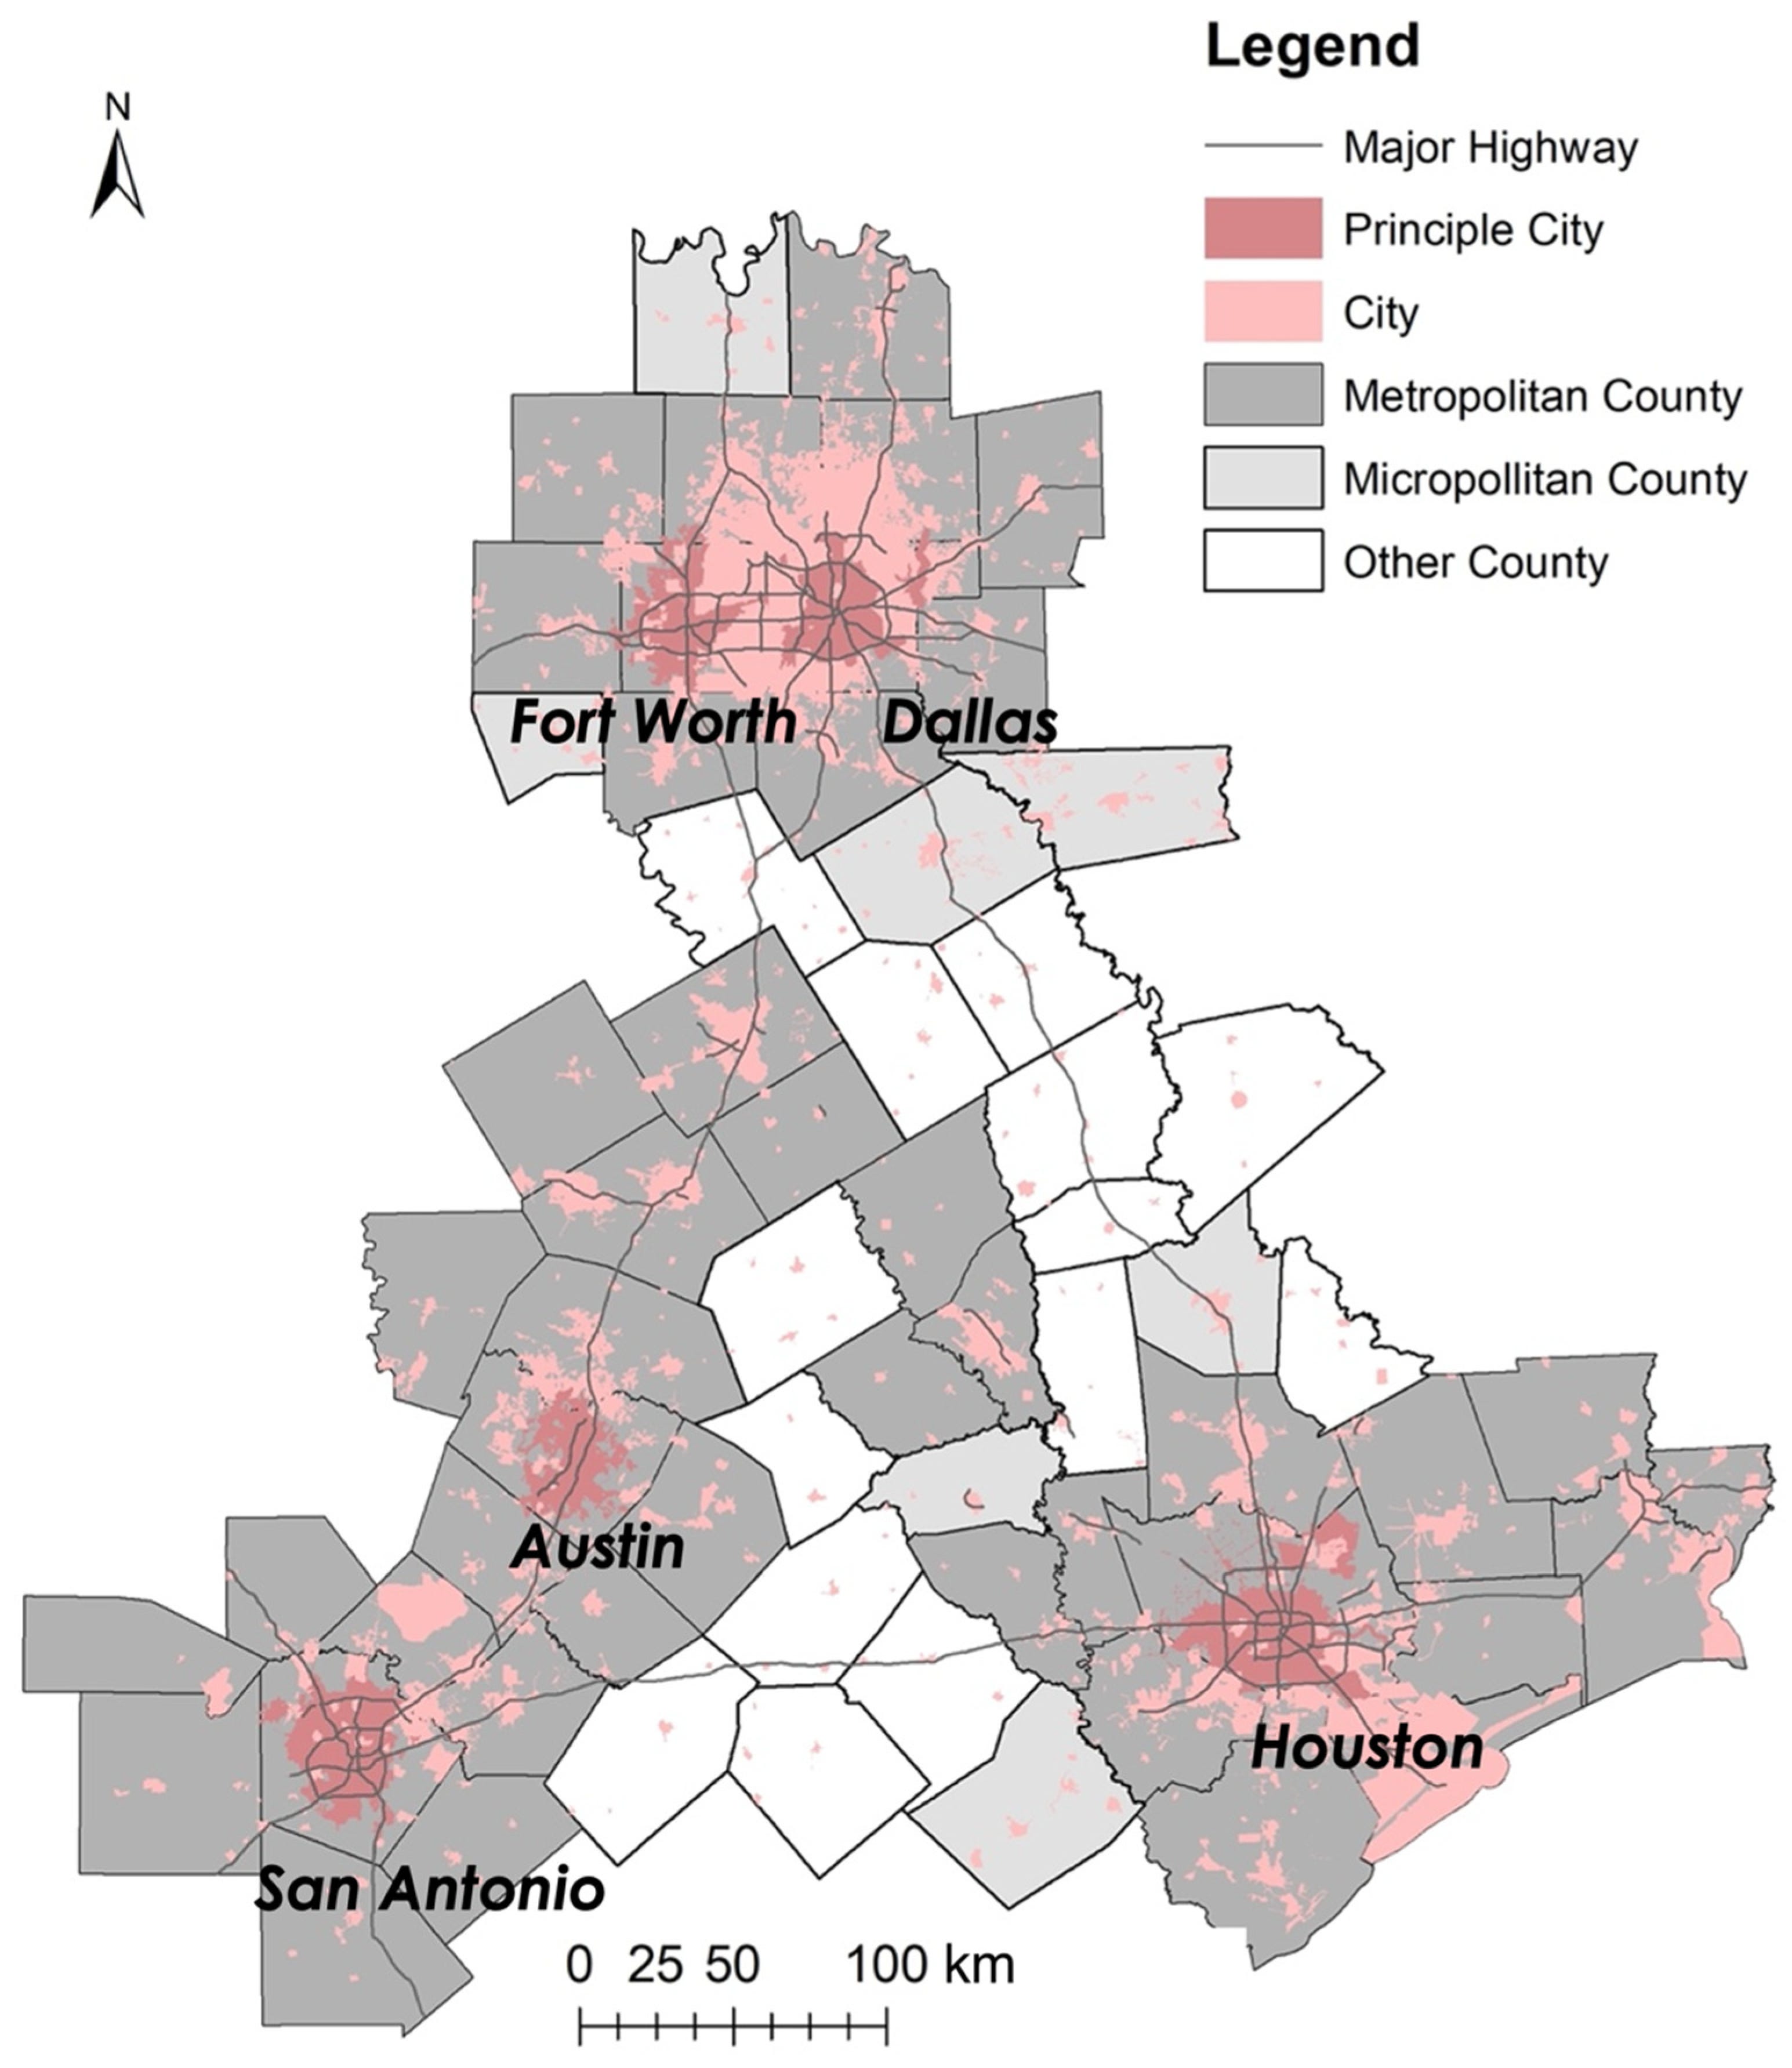
Urban growth worsens impacts: Impervious surfaces around Austin, San Antonio, Houston, and Dallas accelerate runoff and flash floods.5
These shifts show how climate and land use intersect. It’s not just wetter or drier — it’s both, and more volatile overall.
In 2008, hydrologist Peter Milly and colleagues declared: “Stationarity is dead.”6
For decades, water planning assumed the future would mirror the statistically stationary and predictable past. But flood maps, dam designs, and drought plans built on that idea no longer hold.
We laid out land with rulers and grids, assuming water would follow. But floods don’t care about straight lines, and drought ignores boundaries. Modern hydrology rested on Cartesian geometry — flat, fixed, and predictable. But the ground is moving, and the sky is changing. The first two equations describe water in place. The third captures it in motion. This is a geometry of change, where terrain bends, vapor thickens, and assumptions buckle. To keep up, we need models shaped like rivers, not spreadsheets. The future doesn’t follow a line. It meanders.
And yet, we keep describing — and planning and engineering — for a world that no longer exists.
Somehow, we also need journalists — and readers — to get more comfortable with post-Cartesian complexity. Soundbites won’t cut it. If we keep flattening nuance for clarity, we’ll miss the deeper forces fueling the next flood.
VAPOR AND VELOCITY
If Texas is drying and flooding at once, it’s not a local contradiction but a symptom of a larger system. Making sense of that means thinking across scales — not just in miles or months, but how change moves through nested systems.
Cartesian thinking fails again here. It craves fixed frames and tidy domains. But climate operates differently — it scales across time and space, feeds back into itself, and depends on how systems connect. It’s scalar (different behaviors emerge at different sizes), recursive (what happens in one part can echo and evolve through others), and relational (everything depends on what it touches and when). What looks like local chaos may trace back to a tropical pulse, a meandering jet stream, or a burst of vapor from halfway across the world.
Zaitchik’s team shows that local water crises are often global in origin. Warming intensifies storms — but more crucially, it shifts where vapor moves, when it falls, and how it clusters[1]. The water cycle isn’t just speeding up. It’s reorganizing.
Thanks to the Clausius-Clapeyron relationship — a principle from thermodynamics that describes how warmer air effects vapor — each 1°C of warming allows the atmosphere to hold about 7% more moisture. That supercharges storms. Even if rain events stay constant, their intensity rises. The sky becomes a loaded sponge — and when it squeezes, it dumps.
But it’s not just about capacity. It’s about flow. Moisture is moving differently, pooling unpredictably, and dumping in bursts. That’s why Texas sees both longer dry spells and shorter, more intense storms. Systems stall. Jet streams wander. Tropical remnants surge inland. These aren’t bugs. They’re features.
The July 2025 Texas flood may have begun with Gulf moisture: its roots trace to warming oceans, trade wind shifts, and a migrating Intertropical Convergence Zone (ITCZ) — the low-latitude belt where trade winds converge and drive global precipitation patterns. As these systems reorganize, mid-latitude regions like Texas face more extreme rains punctuated by longer droughts[1]. More extremes. Fewer in-betweens.
So Texas’s water future isn’t just about reservoirs and runoff. It’s about vapor, velocity, and vertical motion and the hidden machinery of a water cycle behaving in unfamiliar ways.
This NOAA satellite (GOES-19 captures imagery every 5-10 minutes) loop captures the moisture swirling through the mid-atmosphere (Band 9 is ~20,000 feet) as the Storm pushed inland from July 3rd to the 6th. The darker blues show vapor pooling and stalling over Central and East Texas. This loaded sky, unable to drain, setting the stage for the deadly flash flood. It’s a visceral glimpse of vapor in motion, moving slowly but with devastating impact. A changing water cycle, playing out above our heads. This is what vapor, velocity, and vertical motion look like when they converge.
And then there’s us.
While climate reshapes water, human decisions amplify it. In 2023, hydrologist Yusuke Pokhrel and colleagues showed how irrigation, land use, and water withdrawals distort regional hydrology.7
Ignoring these human factors leads to overestimating runoff and underestimating atmospheric thirst. In some basins, human use matters more than what falls from the sky.
Texas proves the point:
Irrigation in West Texas raises evapotranspiration and disrupts seasonal flow. Large-scale withdrawals from the Ogallala Aquifer reduce groundwater availability downstream, shifting the timing and volume of river flows and accentuates drought conditions in already water-stressed regions[4].
Urban sprawl accelerates runoff and raises flood risk. Expanding suburbs and cities pave over natural land with impervious surfaces, reducing infiltration and sending stormwater rushing into creeks and rivers, often overwhelming drainage systems and increasing the frequency and intensity of flash floods[5].8
Aging reservoirs can worsen both floods and droughts. Designed for a past climate, many are now ill-suited for more volatile conditions — struggling to buffer flood peaks or store enough water during prolonged dry spells. In some cases, outdated operations or degraded infrastructure magnify the very extremes they were meant to manage.9
Texas is a dual-exposure system. The climate shifts. The land shifts. And when they move together, their impacts multiply.
Texas isn’t an outlier — it’s a harbinger. A place where drought and deluge don’t trade places, but collide — sometimes within the same week, on the same watershed. Where the sky swells and the soil gives way. Where century-old assumptions about rain, rivers, and runoff crumble under the pressure of converging extremes.
The story isn’t just about rising temperatures. It’s about a water cycle rewritten by vapor and velocity, by concrete and cultivation, by geometry that flows instead of fixes. As climate shifts and land use compounds those changes, our past models grow brittle. And our narratives? Too often, still binary.
To move forward, we need more than updated flood maps. We need a new language rooted in complexity, scale, and feedback. One that can handle the meander, not just the mean. And we need the will to use it in our plans, our policies, and our press.
Because the future isn’t forged only by what we build. It’s shaped by what we burn. Roads and rooftops matter amidst a rising CO₂. When vapor collides with concrete, we’re reminded disasters aren’t just natural — they’re engineered.
This isn’t just about preparing for the next storm. It’s about admitting the old coordinates no longer work and drawing new ones while we still can.
Zaitchik, B. F., Richey, A. S., Pokhrel, Y. N., Gentine, P., & Famiglietti, J. S. (2023). Clarifying global change hydrology: A call to action for the water cycle community. Nature Water.
NOAA National Centers for Environmental Information. (2023). Climate trends in the southern U.S.: Extreme precipitation patterns. U.S. Department of Commerce.
U.S. Geological Survey. (2023). Streamflow trends and hydrologic variability in Texas rivers. USGS Hydrology Program.
NASA Soil Moisture Active Passive (SMAP) Mission. (2022). Texas regional soil moisture anomalies and drought indicators. NASA Earth Science Division.
Du, Y., Yang, Z., Li, X., & Wang, J. (2022). Urban expansion and flood risk in Texas metropolitan areas. Science of the Total Environment.
Milly, P. C. D., Betancourt, J., Falkenmark, M., Hirsch, R. M., Kundzewicz, Z. W., Lettenmaier, D. P., & Stouffer, R. J. (2008). Stationarity is dead: Whither water management? Science.
Pokhrel, Y. N., Hanasaki, N., Wada, Y., & Kim, H. (2016). Recent progresses in incorporating human land–water management into global land surface models toward their integration into Earth system models. WIREs Water.
Gao, Y., & Li, W. (2021). Urbanization in the Texas Triangle Megaregion: Patterns, Trends, and Environmental Impacts. Land
Rahmani, V., & Scanlon, B. .R. (2023). Reservoir operations and flood risk under climate variability in the Lower Colorado River Basin. Nature Communications, 14.


