


Hello Interactors,
This is week two of Cartography. The next few posts will serve as a series looking at how the map of the United States came to be and its role in charting our history.
This post looks behind the origins of those neatly organized polygons that enable the choropleth maps I talked about last week. Mapmaking’s history dates back to ancient times – as do the motivations behind them. While maps help us to better understand and interact with the world, they also help establish authority and control.
As interactors, you’re special individuals self-selected to be a part of an evolutionary journey. You’re also members of an attentive community so I welcome your participation.
Please leave your comments below or feel free to email me directly.
Now let’s go…

Maps are as elemental to communication as numbers and words. Perhaps even more so. Anthropologists acknowledge that unlike numbers and words, maps don’t require any formal training to understand. It’s been a form of communication for almost as long as we’ve been around. The oldest known map, a map of stars in the sky found in the Lascaux caves in France, dates back to half way through the stone age. It’s hard to imagine just how long ago that was. But imagine your arm as a timeline. If homo sapiens originated at the shoulder and we’re now at the tip of the middle finger, cavernous cartography was happening just above the elbow. Who knows why, but somebody had something to say and they said it with a map. Using their arm to do it.
The Cambridge dictionary says a map is:
“a drawing of the earth's surface, or part of that surface, showing the shape and position of different countries, political borders, natural features such as rivers and mountains, and artificial features such as roads and buildings.”
As early as the Egyptians, people have been drawing maps of the natural landscape both by hand and with the aid of technology. The Ancient Egyptian Turin Gold Mine Map is the oldest surviving land map. It dates back to 1150 BC and features prominent horizontal dried river beds surrounded by mountains with patches of vegetation scattered about. These rocky roads are typical of the riverbeds of this desert that extend to the Red Sea. The map’s legend, written in the ancient Egyptian equivalent of cursive reads, "the mountains where gold is worked: they are colored in red."

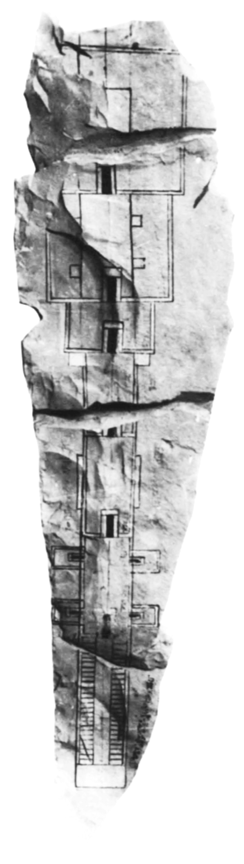
By this time, the Egyptians were also skilled at surveying. We need only look at the precision of pyramids to see they had a firm grasp of geometry. In fact, the Egyptians were employing elements of the Pythagorean theorem 1500 years before it’s namesake, Pythagoras. The word Geometry is derived from Greek and literally means the measure of the earth. (geo-metron, or earth-measure). There are few surviving maps illustrating the precision required for the surveys their construction. But etched in this 14 centimeter high narrow sliver of stone are the plans for a tomb found in the Valley of the Kings. It’s believed to be the tomb of Ramesses IX who died in 1111 BC.
The Greek historian, Herodotus, was the first known historian to write history based on found antiquities and here’s what he observed about the Egyptian’s use of surveying and geometry for a purpose other than tombs and pyramids. Taxation.
“…the king, the priests went on to say, who was responsible for the division and distribution of land into individual square holdings, of equal size, among the Egyptians and for making the plots his source of revenue by fixing the amount of tax to be paid yearly on each holding…I attribute the invention of geometry to this cause and from Egypt it spread to Greece.”
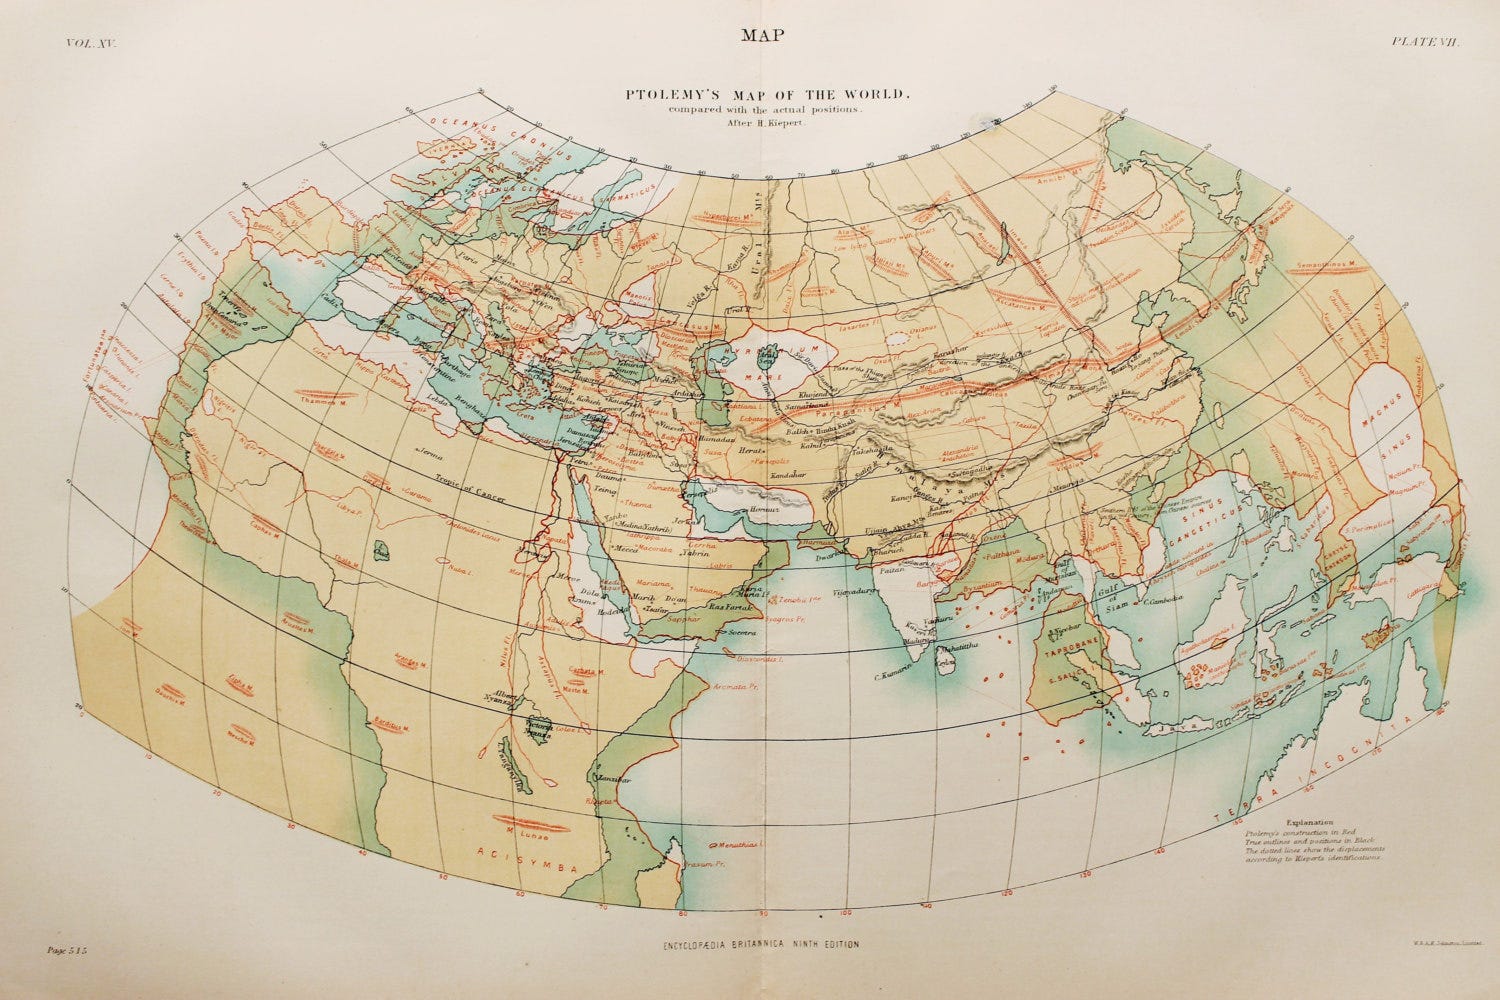
The Greek and Romans went on to perfect the practice of surveying and mapping. In 150 AD Claudius Ptolemy published his massive book called Geography. It was a collection of maps but also a scientific and cartographic treatise. It included a map of the world with a curved grid of latitude and longitude that went on to influence and inspired cartographers well into the Renaissance.
AUGUSTUS CHARTIS
Ptolemy’s work and reputation is so monumental that it’s overshadowed the proliferation, progress, and sometimes punishing practice of practical cartography by the Romans. The surveying and plotting of infrastructure and land was the fuel that fed the fire of Roman expansion and colonization. When we think of the gridded streets and blocks of our modern cities, it’s easy to imagine a map of, say, New York.
But large-scale rectilinear allocation of land started in ancient Rome. In the decades leading up to the first century A.D., Augustus requested surveys of fixed dimensions to designate blocks, or ‘centuries’ as they were called. Major and minor roads ran between them and each block and street was labeled. Like the maps so common today.

Cartography historian, O. A. W. Dilke writes,
“One of the main advantages of a detailed map of Rome was to improve the efficiency of the city's administration. Augustus had divided Rome into fourteen districts, each subdivided into vici. These districts were administered by annually elected magistrates, with officials and public slaves under them.”
The tool used to determine these rectangular subdivisions was a surveying instrument called a groma. Imagine two foot long boards the width of a finger overlapping at 90 degrees to form a symmetrical cross. Now imagine a long pole the length of shovel handle with tripod arms to keep it upright. The cross connected to the top of the pole with a bracket that it allowed it to pivot around the pole. Dangling from the tips of the cross were long strings with lead weights attached to their ends.
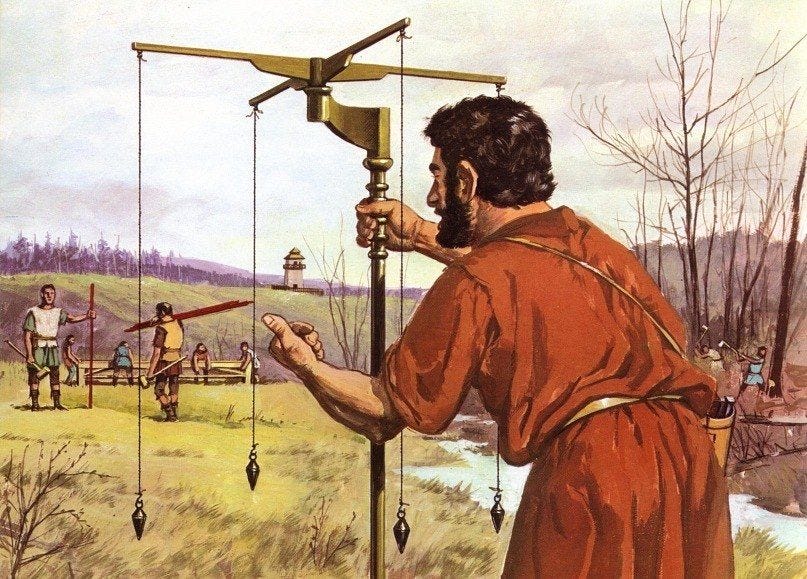
The surveyor would use a portable sundial to first determine a north-south orientation and then drive a stack in the ground as a point of origin for the first plot. The groma would then be place near the stake with one of the lead weights positioned above the stake. An assistant would walk 120 feet in the general direction of one of the cross members holding a long stick. (120 feet was the customary distance an ox pulling a plow would walk before being turned.) The surveyor would then approach the groma facing the assistant, most likely with one eye closed, and direct his assistant to the left or the right with his long stick held vertically. When the stick lined up with the dangling strings the surveyor would ask his assistant to place the stick in the ground. This established a straight line between two points along which more stakes would be placed.

A line would then be drawn on a portable wax tablet, papyrus, and eventually the same paper I used to draw maps in college – vellum. This process would be repeated until all the plots were designated and drawn. More permanent cartographic records of the surveys were then etched into bronze and stored for safe keeping. Land surveyor Hyginus Gromaticus published a book of surveying somewhere between the year 98-117 AD where he documents the practice.
“We shall write both on the maps and on the bronze tablets…all mapping indications, "given and assigned," "granted," "excepted," "restored, exchanged for own property," "restored to previous owner," and any other abbreviations in common use, to remain on the map. We shall take to the emperor's record office the mapping registers and the plan of the whole surveyed area drawn in lines according to its particular boundary system, adding the names of the immediate neighbors. If any property, either in the immediate neighborhood or elsewhere, has been given to the colony, we shall enter it in the register of assets. Anything else of surveying interest will have to be held not only by the colony but by the emperor's record office, signed by the founder. This is how we shall allocate undeveloped land in the provinces.”1
THE VANISHING LINE
The Romans perfected large scale cartography through colonization. A practice now called cadastral mapping. The word cadastral is derived from the Greek word, katástikhon: to organize by line. Cadastral maps use measurements and coordinates to designate plots that delineate ownership and delegate magistrate. It’s a practice they spread throughout Europe and around the world and is still used today. Somewhere there is a cadastral map describing the land you’re sitting on as you read or listen to this post. But there is no direct lineage from ancient Roman cadastral maps and ours. As the Roman Empire fell in 476 AD so did precision mapping. Including cadastral maps. Map historian P. D. A. Harvey writes:
“…the observance of a fixed proportion between distances on the map and distances on the ground, played practically no part in medieval maps of small areas; they were scarcely ever based on measured surveys.“
And of the measured maps remaining from this era, like the detailed gridded maps of Palestine for example, nearly all of them are drawn from an imaginary point of view, often floating from above. Most are more pictorial than graphic and rely on text to describe topographical features. Written records seem to have displaced map making during these centuries. There are only three known English maps until 1350. But something changed in 1500. Again, map historian P. D. A. Harvey writes:
“…from the mid-twelfth to the mid-fourteenth century we have only three [maps] in all, from each half-century between 1350 and 1500 about ten, and from the half-century 1500-1550 about two hundred.”2
With the Renaissance came new materials, pigments, paintings, methods of mathematics, and more maps. Maps were being made of the sky, the sea, and the land. Often in coordination with global European expansion. Including the colonization of America.
Nautical and celestial charts were crucial to voyages to America by Europeans in search of gold, slaves, and land. Upon disembarking from their ships, Europeans turned again to surveying, subdividing, and subduing the land. And its occupants. Cadastral maps re-emerged in the 16th and 17th century, but mostly at local scales. And then came the American Revolution. Thomas Jefferson had big plans for American expansion and worldwide dominance. They needed land and it needed to be organized by line. They needed cadastral map generation at a Roman scale. And so that’s what they set out to do.
WHEN IN AMERICA, DO AS THE ROMANS DID
One of the earliest cartographers in the British Colonies was a Scottish engineer and immigrant, Robert Erskine. He ran an ironworks plant in New Jersey starting in 1771 – the same year the British awarded him fellowship into the prestigious Royal Society for his contributions in engineering. But he was sympathetic to the American cause and as war broke out with the British, he organized his workforce into a militia. He also engineered an underwater blockade that was placed in the Hudson River to stop British boats from advancing. George Washington took note of his engineering and cartography prowess and made him Colonel. He also made him the army’s Geographer and Surveyor General.
In 1778 Erskine hired an assistant, Rutgers University’s first and only graduate, Simeon DeWitt. Together, these two drew a sizable collection of maps of the northern British Colonies. Many of which are accessible today through the New York Historical Society’s digital collection. A good number of which include maps to taverns sprinkled around the early settlements. DeWitt went on to survey and layout the gridded pattern of New York City in 1807. Property owners and proprietors had differing opinions of how roadways were to be laid out in the city so the state stepped in and appointed DeWitt to issue a plan. His plan was rectilinear and Romanesque. Orderly and taxable.
Back in 1781, George Washington showered praise on DeWitt just as he did Erskine. He encouraged Virginia Governor, colonial expansionist Thomas Jefferson to award him the title of Geographer of the United States. Jefferson offered, but DeWitt turned him down. He preferred to settle in his beloved Albany, New York. But there was another surveyor, engineer, and cartographer, Thomas Hutchins, who had been making a name for himself charting territories to the west and south of the British Colonies. In 1781 Hutchins was awarded the title Geographer of the United States. Nobody has held that title since.
Hutchins was born in New Jersey in 1730 and at age 16 joined the British Army. He soon found himself fighting in the French and Indian War. Showing skill in surveying and engineering, the army hired him as an engineer in 1766. Shortly thereafter he was floating down the Ohio river surveying newly acquired land by the British as part of the 1763 Treaty of Paris. Eight years later, in 1774, he found himself floating down the Mississippi River collecting data that was soon to be published in his upcoming book, “Historical, Narrative and Topographical Description of Louisiana and West Florida.“

But Hutchins witnessed ugly war atrocities during his time with the British Army, including the execution of Scottish soldiers at the hands of their fellow British troops. Many in the English infantry didn’t much appreciate fighting alongside Scottish Highlanders. Witnessing the savagery and in-fighting, the American Revolution was becoming increasingly attractive to Hutchins.
In the final years of his British sponsored excursion down the Mississippi, he began sending coded messages to the Americans – including Benjamin Franklin. The British suspected as much and had him investigated. Hutchins’ knowledge of Indigenous American land was too valuable to be handed to the Americans. In 1780 Hutchins left the British Army and was promptly convicted of treason. He escaped to France and connected with Franklin and asked to join the American army. He was perhaps the only British officer to switch sides during the war.
A year later, in 1781, he was awarded his United States Geographer title. His biggest job was about to begin. Thomas Jefferson was seeking to expand Virginian and American enterprise westward and south into Kentucky and Tennessee. He had been reading Hutchins’ maps and descriptions from his journeys down the Ohio and Mississippi Rivers. But Hutchins’ maps weren’t convincing to Jefferson. He had questions. The newly appointed United States Geographer was about to be challenged by Jefferson on his cartography skills. In a 1784 correspondence to Hutchins’, Jefferson writes:
“…Excuse my freedom. I think this an error in your pamphlet and would wish to know from you whether I see it wrong.”
What Jefferson was referring to? Just how far off was their shared understanding of the mass expanse of land that lie just beyond the Ohio and Mississippi Rivers? Together, these two men were about to carve up Indigenous land into neatly ordered surveyed squares of states, counties, townships, real estate – America’s first cadastral maps. But they had no idea what lie before them.


