

Hello Interactors,
Cities are sprawling, the climate crisis is appalling, left and right are brawling, and politicians are stalling — leaving many in a corner bawling. It’s enough to lead some star-gazing billionaires to want to colonize space. But we planned for this with cunningly precise maps. Have we always been this dim? The evidence suggests yes and no, opinions vary on why, but scaling laws offer clues on calculating a plan.
As interactors, you’re special individuals self-selected to be a part of an evolutionary journey. You’re also members of an attentive community so I welcome your participation.
Please leave your comments below or email me directly.
Now let’s go…

GET ME OUT OF HERE
I am not a happy camper. I’m only really a happy camper when I’m far away from other campers – whether they are happy or not. It’s been awhile since I’ve camped, but I prefer solitude when seeking solitude. But as regional populations grow and more people are also seeking solitude, it’s harder and harder to ‘get away from it all.’
Car-camping definitely doesn’t do it for me. Especially now that most everyone has a phone blasting music through a Bluetooth speaker. I’ve seen some campers with solar panels, a satellite dish, and a TV blasting the news or sports. As night falls, and the alcohol comes out, I imagine I’d be laying there wondering where the nearest hotel is. And as the sun rises the kids start crying, hangry parents begin yelling, and cars fire up as people start heading out…presumably to get some rest.
I admit it’s more fun when you’re with a bigger crowd of family or friends. The revelry is more tolerable when it’s coming from within your circle. Sure that one uncle may be a bit obscene, but he’s family. These kids running around may seem obnoxious, but weren’t we all? I can imagine indignantly brushing off our loudness with, “at least we’re laughing.”
I remember as a kid growing up in Iowa camping with a friend and his family in their spacious camper-trailer. They had been doing it years and had made friends with other camper-trailer families. They’d roam together from campsite to campsite over the camping season. On the first night, around dinner time, I remember being handed a wooden spoon and sauce pan. My friend’s dad looked at me holding a skillet in one hand and a hefty metal BBQ spatula in the other, and said, “Just follow me.”
He stepped out of the trailer and started banging the spatula against the skillet. I followed along with the rest of the family playfully pounding my pot. It was then I realized we were being subsumed by a cacophonous cavalcade of culinary clanging campers. As we descended upon the campsite of an unsuspecting family, I realized I was participating in some kind of tribal ritual. It turned out this was their first night camping in their shiny new trailer; another member of the tribe, initiated. After everyone retreated back to their campers for a proper use of utensils, we regathered again; but this time around a common fire. We shared and prepared ingredients for another North American tribal ritual – S’mores.
The desire to come together around a campfire in the great outdoors is as old as Homo sapians. The welcoming ritual I participated in signaled cooperation; it acknowledged a trust between people who were not blood related. It’s an interaction of people and place that consecrates a common bond that is strong enough to incent people to repeat this ritual of cohabitating, and sometimes confabulating, around a fire.
These people share common ideals, backgrounds, desires, and sometimes even food. But for our prehistoric hunter-gather ancestors, the gathering and sharing of food was the top priority. The concentration of other families and tribes in a common space evolved to be a worthwhile endeavor. Close proximity with cooperative individuals resulted in sharing knowledge. Locals could offer advice on growing or gathering edibles and how best to hunt animals. (or assemble S’mores)
Labor could be divided, exchanges could be made, and rich – though often simple and informal – socio-economic systems could flourish amidst the interaction of people and place. Soon bonds are formed, breeding between families occurs, and the circle grows. Evolution rewarded this agglomeration of people and commiserate growth of a concentric area of shared space. It formed the basis of permanent human settlements, so long as balances were struck.
Over-crowded campsites, like contemporary cities, can be annoying. People are loud, some are rude, violent or selfish, and others steal – and anyone can spread illness and disease. Conflict is inevitable. Eventually, individuals and small groups decide to break away from it all. They set out to make temporary camps far away from concentrated populations of people. They may roam and hunt and gather for themselves making temporary settlements along the way. Sometimes they’d form their own settlements, while other times remain mobile. Evidence of this exists around the globe and across the history of humankind.
For centuries researchers have been uncovering evidence that leads to these theories. They’ve uncovered community plans, maps, and descriptions of place. Archeologists, anthropologists, and ethnographers have written countless descriptions and interpretations of found artifacts, ecologies, and environments from research sites around the world. Over the years these fields have agreed on what they call a ‘settlement scaling theory’ – a systematic study of the conditions leading to the population dynamics of human settlement. Research demonstrates that there are traits and conditions universally common to all of humanity, but that there are also cases of particularities and uniqueness as well.
SCALE IN PLACE OR SCALE YOUR SPACE?
Recently an interdisciplinary group of archeologists and urban scientists decided to contribute quantitative evidence to these theories of settlement scaling. So they compile a database of over 1000 different ethnographic studies conducted and published over centuries from around the world. In February of 2022, they published a paper called Scaling of Hunter-Gatherer Camp Size and Human Sociality that proposes a mathematical model that can be used to measure human population dynamics of settlement.
They derived and observed three mathematical scaling relationships looking at both settled and mobile hunter-gatherer societies.
Super-linear Growth: As concentrated populations increase it induces a greater than proportional increase in the area of the settlement. Imagine a campsite growing in population and needing to expand to make room for others.
Linear Growth: When populations remain equal (or nearly equal) the area remains equal. For example, the number of campers and the size of the site remains constant.
Sublinear Growth: Despite a population growing, the area remains the same or shrinks.
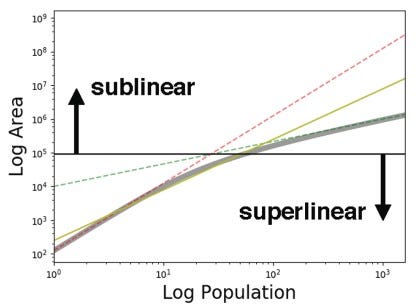
The first two are easy to imagine, but the last one less so. If we speculate these laws could be loosely applied to our current cities, it’s easy to point to examples where the footprint of a city grows or stays the same as the population grows or stays the same. But populations growing within an existing footprint is rare. I suppose one great example is Hong Kong. They built high into the sky to house a growing population and dug deep into ground to transport them with multiple levels of trains – all while keeping the perimeter of the city proportionally relatively constant.
A more ancient example offered by the researchers was found right here in the Pacific Northwest. The Haida, Kwakiutl, Nootka and Tlingit people along the Northwest coast all built permanent or semi-permanent settlements with growing populations despite the area of their settlements growing accordingly. They write,
“Mollusk collecting, harvesting of salmon and acorn stocks, organized communal hunting of sea mammals or terrestrial large game, gathering of nuts and berries, developed storage technologies, and a variety of sociopolitical and ritual institutions enabled societies on the Pacific Coast of North America to support semipermanent or permanent settlements that were inhabited for multiple years. The sublinear relationship between population and area observed in these settlements suggests that in larger settlements houses were spaced more closely together, contained more people per house, or both.”1
This should be a rallying cry to density advocates everywhere!
These researchers claim to have included plan maps of settlements as part of their data collection, though I’m not certain how they were interpreted or coded. Sadly, most prehistoric maps are lost. Countless maps have been made by humans throughout history sketched in the dirt with a stick, marked on bark with charcoal, or inked onto animal skin. Often times maps were intended to be ephemeral or kept secret. While there are archeologists who confidently claim the rationale and meaning behind these prehistoric plan maps, some cartography historians claim they often lack the necessary surrounding evidence to be convincing.
One of the oldest examples is of what archeologists have interpreted to be of a settlement along a river that are etched in the tusk of a Mammoth dating back to the Ice Age 25,000 years ago. Found in 1966 in Ukraine, the ‘map’ features four shapes that are thought to represent dwellings along the Ros River. But cartography historian Dr. Catherine Delano-Smith finds it difficult “to see a close resemblance between the features scratched onto the bone and the excavated mammoth bone dwellings whichever way the drawing is oriented.”2 In other words, it’s unclear whether this is really a map.
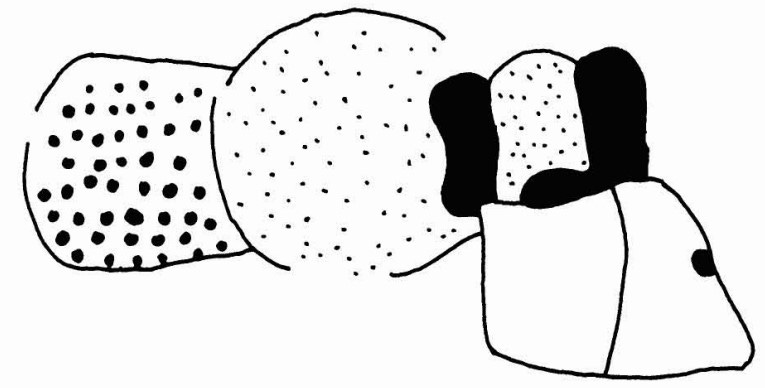
A better candidate for a true surviving prehistoric map are the plan view maps from the Stone Age, roughly 12,000 years ago, in the petroglyphs of Mont Bégo in the Maritime Alps of Southern France. According to Delano-Smith these maps satisfy six or seven of the ten criteria needed to be considered a plan map by cartography historians: “Two (at least) hut signs; five enclosures (or four enclosures, one with a path across it); and three land-use signs (two forms of stippling and unstippled areas).”3
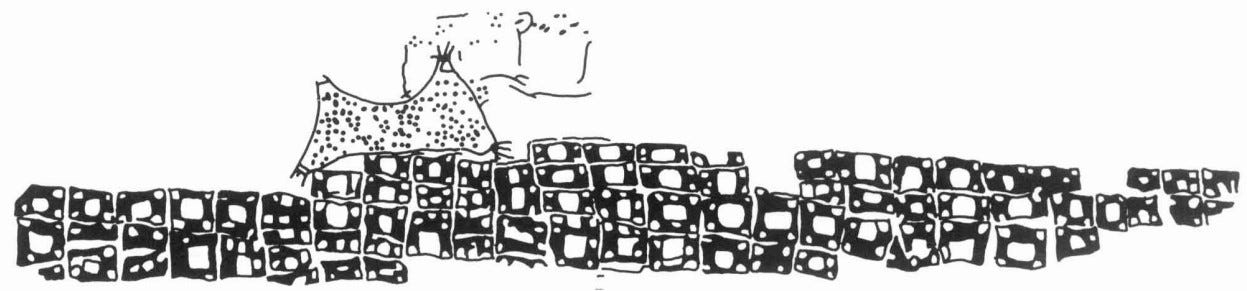
But another Neolithic map found on two walls in Turkey helps boost evidence of prehistoric plan maps. Delano-Smith notes that,
“It would be difficult to see in this rectangular pattern anything of cartographic relevance were it not for the extraordinary resemblance of the rectangles in the wall painting to those drawn by the archaeologists as part of their excavation plan.”4
While Delano-Smith believes there is “no neat evolution from one type [of map] to another, either from prehistoric to historical contexts or even within the historical period,”5 she believes there are shared concepts and purpose of maps. This is as true for prehistorical maps as it is for, as an example, the historical medieval maps of Europe. And while there are few surviving maps from that period as well, we know more about the history that surrounds them.
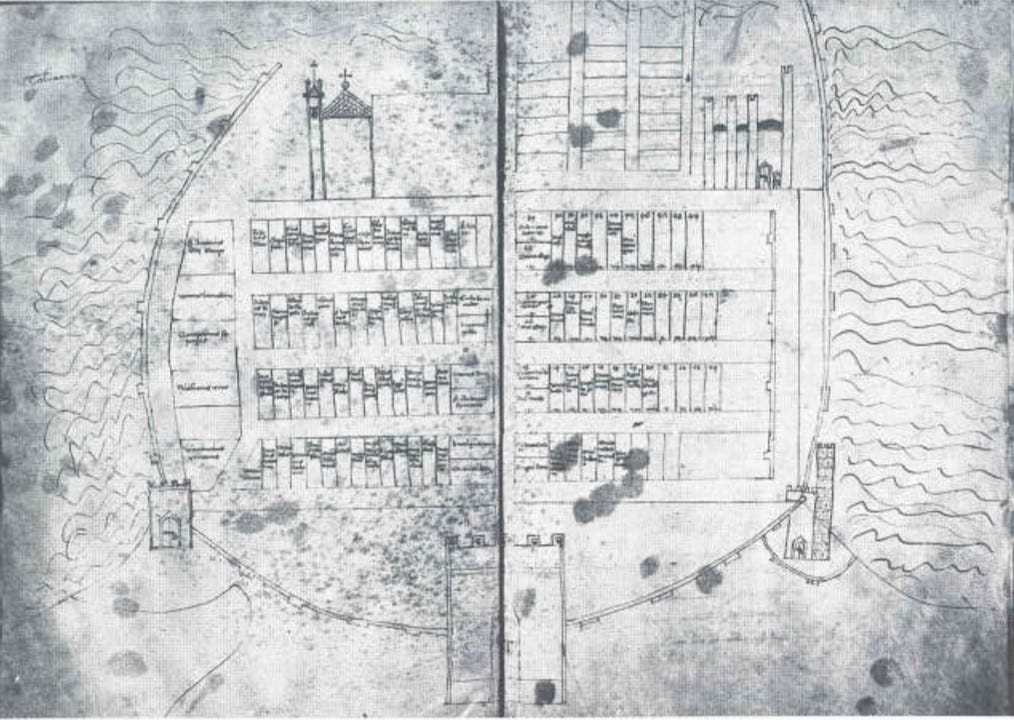
Of the few maps of medieval cities that remain, they all share something in common with maps that had been made for millennia prior – they feature orthogonal grids. Even the Stone Age plan map found in Turkey conforms to a loose grid. Well before surveying was invented, it appears gridded plan maps were convenient ways to virtually slice and dice land. Mapmakers, and their patrons, need not even visit the site to determine how it was to be used. One such Medieval example is a 1306 plan map of the town of Talamone in Tuscany on the west coast of central Italy.6
ESCAPE OR ENGAGE?
As the Middle Ages gave way to the Renaissance, 15th century city plan maps proliferated alongside burgeoning European cities. They, and other historical artifacts, offer cultural clues that suggest elements of settlement behavior consistent throughout human history. For example, in 1551 a new residential development called The Strada Nuova was requested to be planned by a clan of nobility in Genoa, Italy. They wanted a neat little enclave tucked into a hillside where they wanted to move “in the proximity of relatives and dependents to a residential area based on class rather than blood.”
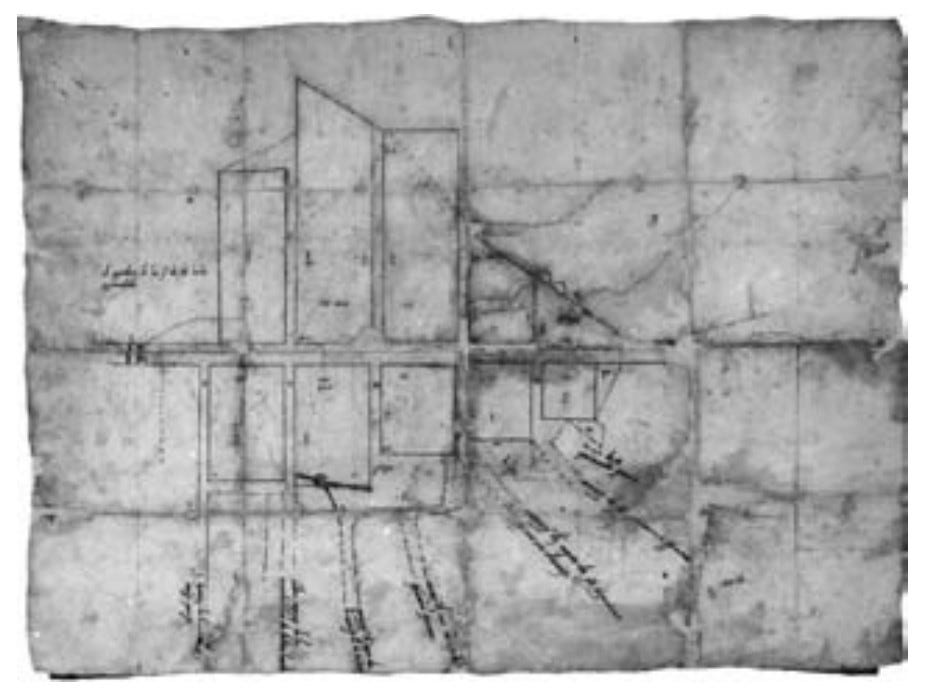
Like suburban residential developments of today, these lots were drawn with generous amounts of room and were neatly arranged. These plots were designed by Bernardino Cantone, a city administrator who not only assessed the value of property but arranged them next to the streets he was also planning. You have to wonder if these wealthy elite suburbanites were wanting ‘to just get away from it all’ and escape with their friends from the riff-raff in the city center.
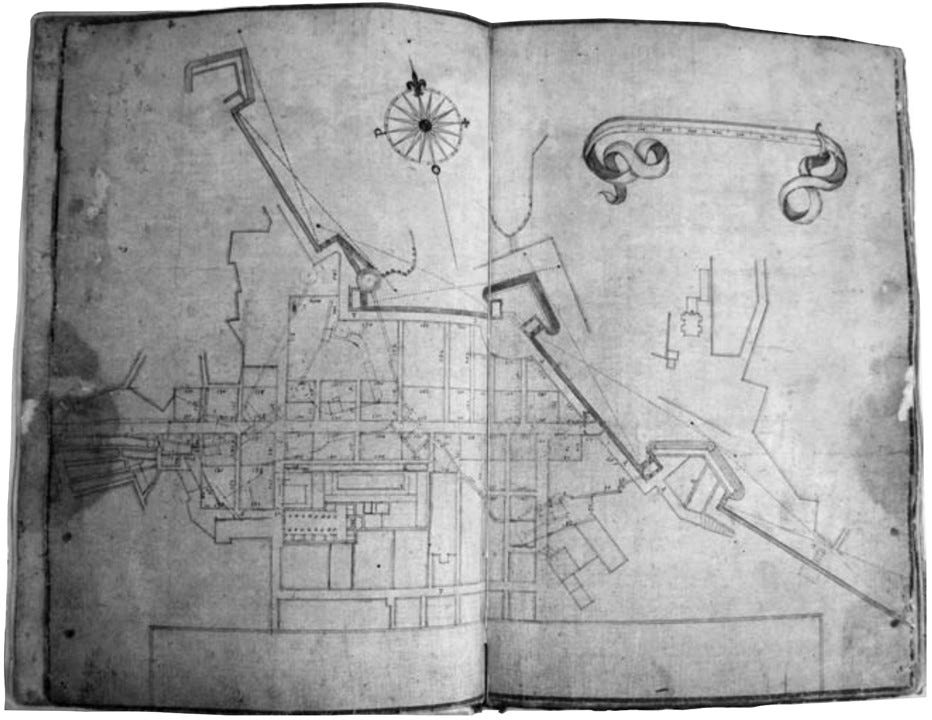
It could be they were also seeking protection. Forty-four years after The Strada Nuova was first designed, nobleman Pietro Battista Cattaneo came along and modernized and fortified development. Cattaneo brought a new approach to urban planning that was rooted in survey technology. His plans included specific dimensions and were oriented like a proper map complete with a compass rose. His transformation plan for the Strada Nuova Development is considered the oldest surviving example of a full city plan.
The complex and detailed city plans of the Renaissance are a graphical record of a built environment that a) affords privacy to concentrated settlements of unrelated people and b) regulates interactions between people and place. These two factors in the emergence of permanent settlement suggest to those urban scientists in search of scaling patterns a watershed moment “in human development that made possible the open-ended accumulation of social products, in the form of stocks of knowledge and goods.”
They “conclude that longer-term camps and eventually permanent settlements require both energetically and socially favorable conditions, which can be realized in different ways in different physical environments and through cultural/social conventions/structures. Failure to realize break-even (or better) levels of energetic and social production simultaneously will lead to periods of alternating group fission and fusion.”
They also emphasize their mathematical models are just that – models. They warn against a polarizing of interpretations of human behavior that is hard to describe and explain mathematically. Nonetheless, their research, like the traditional research they drew from, “steers a course between claims of universality for common human social and cultural traits and claims of particularism and uniqueness for individual cases.”
I do wonder how these scaling laws relate to the fact European cities today continue to sprawl despite their populations declining. Have they failed to ‘realize break-even (or better) levels of energetic and social production simultaneously?’ Are we seeing an alternating from the ‘fusion’ of populations in these cities starting with the Renaissance to a recent ‘fission’ of settlements that are leap-frogging from the ill effects of the so-called Anthropocene? Or are elites just seeking another Strada Nuova?
And surely there’s something to be learned from those coastal tribes of the Pacific Northwest who managed to grow and prosper as a population and as a culture without increasing their footprint. Perhaps more investigations into urban sublinear scaling are what is needed for us to draw new plan maps of our cities to achieve sustainable living. If we don’t do something, none of us will be happy campers. We’re already becoming loud, rude, and annoying. And that’s before the alcohol. The plan maps of the 50s and 60s, their dependency on cars, the insistence of developing countries to emulate them, and a collective human desire to increase consumption and comfort in settlements worldwide has led to humanity exceeding the carrying capacity of our only campsite – planet earth.
There are some who want to escape and colonize Mars, but I’m sticking with the evidence and opinion of these researchers when they conclude that the societal costs of agglomeration, “must be overcome through social or technological innovations.” Those innovations include “property rights, food production, group rituals, political institutions, substantial shelters, and more.” Only when these transformations occur will the “open-ended densification [of] permanent settlements [] emerge.” Only then will we be happy campers.
Scaling of Hunter-Gatherer Camp Size and Human Sociality. José Lobo, Todd Whitelaw, Luís M. A. Bettencourt, Polly Wiessner, Michael E. Smith, and Scott Ortman. Current Anthropology, volume 63, number 1, February 2022.
Cartography in the Prehistoric Period in the Old World: Europe, the Middle East, and North Africa. Catherine Delano Smith. The History of Cartography, Volume 1: Cartography in Prehistoric, Ancient, and Medieval Europe and the Mediterranean. 1987.
Ibid.
Ibid.
Ibid.
Portraying the City in Early Modern Europe: Measurement, Representation, and Planning. Hilary Ballon and David Friedman. Volume Three (Part 1) Cartography in the European Renaissance. 2007.


