


Hello Interactors,
There’s but a short window of time
When the dirt is in its prime
Not too cold or wet
Or the seeds will not set
Last week the fields were lakes
This week the soil bakes
Gone is the mud and grime
So into the tractors they all climb
It’s time to get those seeds in the ground! If you have the space. The state of Iowa, where I grew up, has this as their slogan: ‘A Place to Grow’. But those places are being displaced by homes at a record pace.
As interactors, you’re special individuals self-selected to be a part of an evolutionary journey. You’re also members of an attentive community so I welcome your participation.
Please leave your comments below or email me directly.
Now let’s go…
GROW BABY GROW
We bought our first corn on the cob this week. It’s from California. Growing up in Iowa we didn’t see corn until late summer. To get corn stalks to be ‘knee high by the fourth of July’ meant getting the seeds in the ground by the end of May. That’s now. Iowa farmers have been stressed out these last couple weeks. The planting window was closing fast and the state was getting unseasonable rain and cold temperatures. Ten days ago one farmer in northeast Iowa said he could ride his boat across his fields.
Such is the life of a farmer. But the weather turned in their favor this week. They’ve been busy. On May 23rd the USDA reported 86% of Iowa’s corn crop had been planted and 47% of seeds planted earlier are already sprouting. But corn, soybeans, and oats are all behind schedule. Let’s hope the wacky weather patterns don’t wreak havoc on these weathered wonder-workers. I like my corn tortillas, tofu, and oat milk. Though, most Iowa grains and soybeans are fed to livestock, not people.
And we know people like their burgers and bacon. Increased commodity prices are the number one reason some farmers give for why farmland value in Iowa is through the roof. Last year a farmer in Eastern Iowa’s Johnson County made headlines when he sold 40 acres of two 80-acre tracts for $26,000 per acre. That’s over $2,000,000 for 40 acres (the equivalent of 20 soccer fields).

But that pricey southern most 40 acres is comprised of Klinger soil – a claylike sandy substrate formed by glacier tills. This soil is perfect for the native prairie grass but crops struggle. So this opportunistic farmer decided to plant a more profitable crop that has no agricultural value at all. Houses. He sold the worst soil for the most money to a developer who is expanding the sprawl of a nearby small town city called Swisher; population 914. It’s a 15 minute drive south of Iowa’s second largest city, Cedar Rapids.
The conversion of farmland into housing developments is a common sight across Iowa. The U.S. Department of Agriculture (USDA) does an agricultural census every five years and the last one was done in 2017. The 2022 version is due later this year. From 2012 to 2017 Iowa lost 2,533 farms. That leaves 86,104 farms remaining. There were over 10,000 more farms in 1997 and nearly 20,000 more when I left Iowa in 1984. The amount of land dedicated to farming shrank by 59,000 acres.
Much of this reduction is from consolidation. The number of large farms (>2000 acres) grew 15% to 1,892 over five years. By comparison, there were barely 300 large farms in 1987. From 2012 to 2017 large farms had gobbled 10% of up mid-sized farms (500-999 acres). Small farms (fewer than 9 acres) grew 36% to 9,120. That’s a big jump in five years, but only 1000 more than 30 years ago.
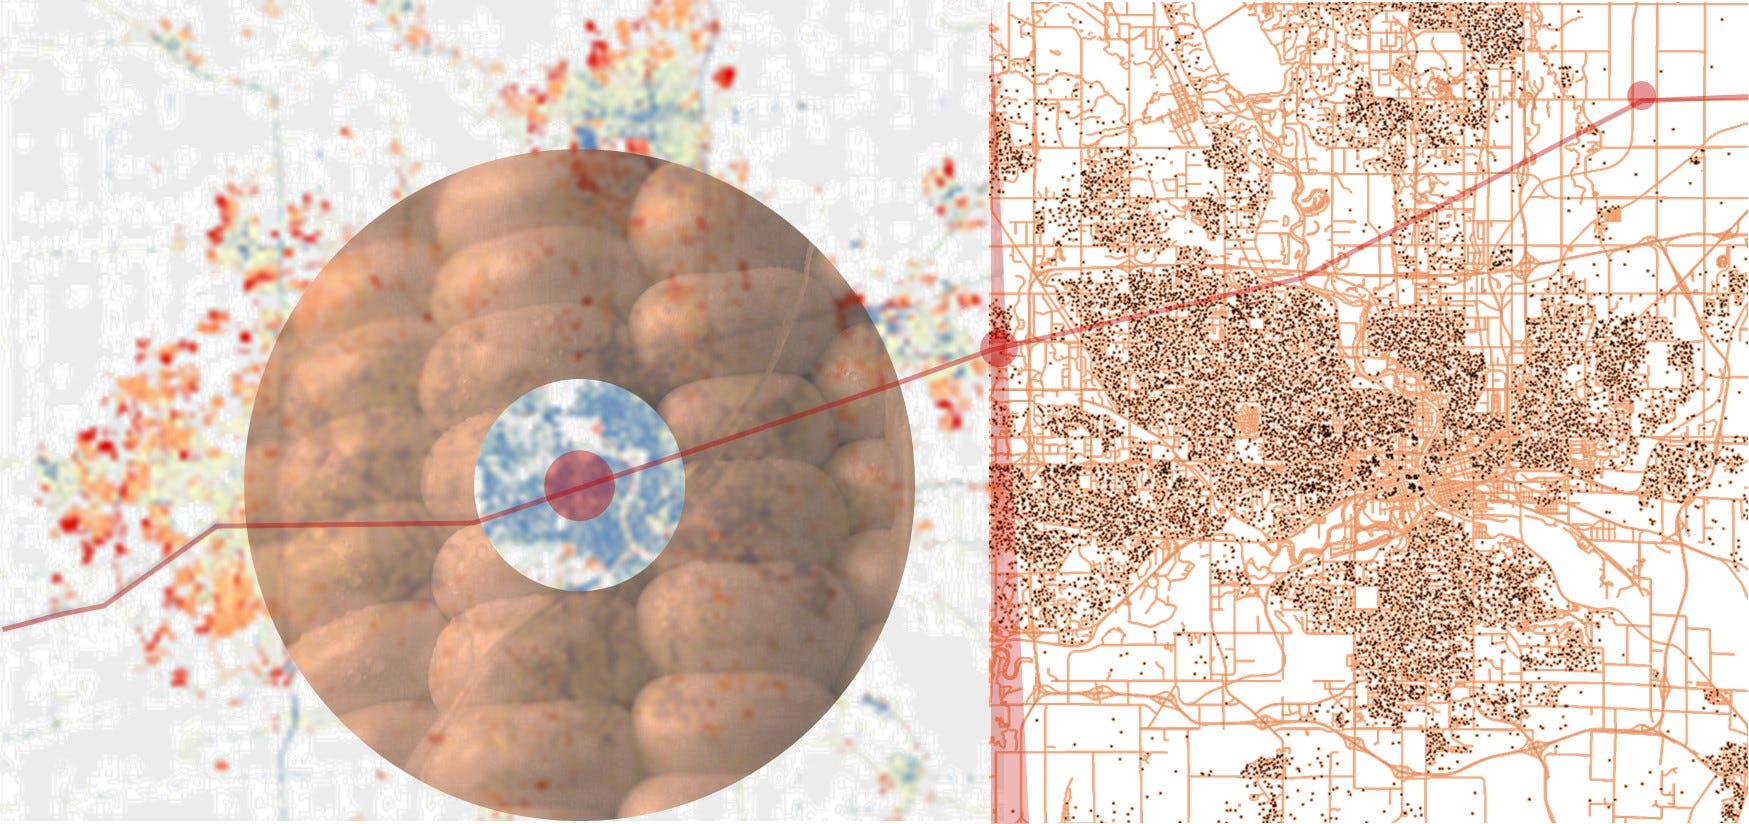
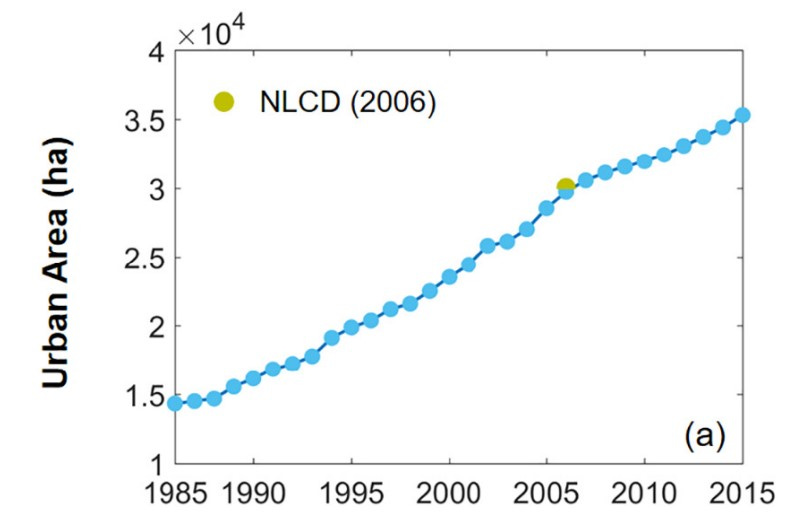
These figures from the USDA tell the story of farmland consolidation across Iowa since the 1980s. But to get a picture of how farmland sold to developers contributes to the sprawl of urban areas, more and more researchers are turning to satellite imagery. In 2018 two researchers from Iowa State University were lead authors on a paper demonstrating novel image processing techniques for mapping the dynamics of urban growth. They took a series of satellite images from 1985 to 2015 of a region encompassing the Des Moines Metropolitan Area. They then trained software to differentiate between the natural and built environment by looking at the color of the pixels in the images. Pixels turning from looking ‘natural’ to looking ‘urban’ over time revealed a growing gray blob of concrete known as urban sprawl.
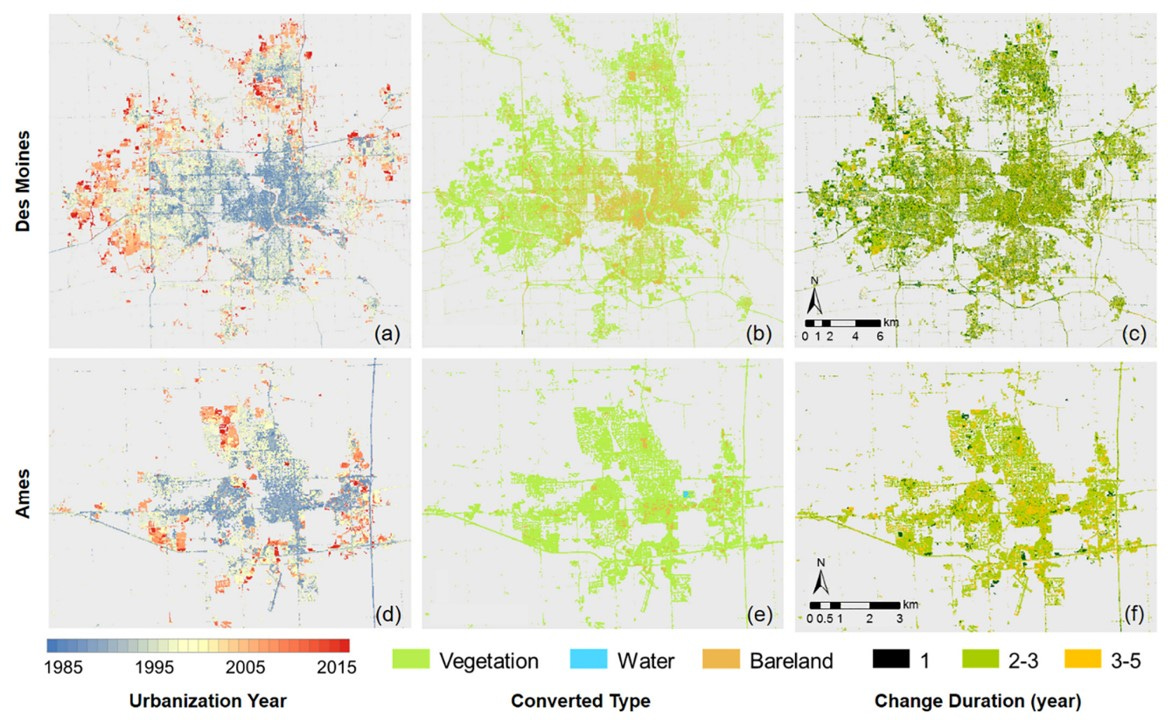
They found, with 90% accuracy, that the Des Moines Metropolitan Area urban boundary more than doubled between 1985 and 2015.1 Over those thirty years the area grew linearly from 58 square miles in 1985 to just over 135 square miles in 2015. Most of which, of course, was farmland. At this growth rate, it will continue to double again every 30 years.
Area growth like this is usually the result of an increasing population. The Des Moines Metropolitan Area is no exception. From 2010 to 2020, the population in this area grew 17% from 606,465 to 709,466. You might imagine the city of Des Moines being at the heart of this growth given it’s the center of the metropolitan area, but you’d be wrong. Of the top ten most populated cities in the area, Des Moines proper grew the least at 5.3% and has been relatively flat for decades. The fastest growing city from 2010 to 2020 was a town just north of Des Moines called Grimes. It grew a whopping 87%. Another town to the north, Ankeny, was second at 49% and my home town, Norwalk, just to the south, grew the third fastest at 43%.
These are some of the fastest growing cities in the country. Impressive. Until you consider the overall population of the state of Iowa only grew 4.8% compared to the U.S. population rate of 7.4%.
It's a curious fact that the Des Moines Metropolitan Area is growing in population at a rate far greater than the state is. This means Iowans are 1) moving to metropolitan areas from rural areas, 2) between cities within a metropolitan area, or 3) to another state all together. I reached out to a friend who recently moved from West Des Moines to Des Moines after they became empty nesters. He said they didn’t need as big a house and wanted to be closer to restaurants and entertainment. His wife added that they looked at surrounding suburbs but the house in Des Moines offered the best value.
I then contacted another friend who sells real estate in the area. She told me people are obsessed with new construction. Her clients repeat the same refrain, “I want a new kitchen with granite countertops, white cabinets, and a tile floor.” My friend has an eye for houses with good bones and an affinity for mid-century classics. She tries to sell their vision to her clients by fixing up these older homes, but there’s little interest. She said, “It’s like so much else in their life. Out with the old, in with the new. Why fix it when a new one will due?” So she spends a lot of time driving to the fringes showing new construction in cities like Grimes, Ankeny, and Norwalk.
THE RADICAL, THE DYNAMICAL, AND THE MEGLOMANIACAL
The hollowing out of city centers as people move to the fringes, the ‘donuting’ of metropolitan areas, is common. Especially in the Midwest. Detroit gets all the attention, but the rust belt is filled with them. It occurs in cities around the world.
In 1969, a professor from the MIT Sloan School of Management, Jay Wright Forrester, developed a theory and computer model for this phenomenon in a booked titled Urban Dynamics. If you’ve ever played the computer game SimCity then you have Forrester to thank. The game is built on his model. We have many things for which to thank Forrester. He helped to invent random access computer memory (RAM). He was also a pioneer in computer graphics before computers; he figured out how to get a ball to bounce on an oscilloscope screen. And the current reverberations of supply chain perturbations is called the Forrester Effect as described in his 1961 book called Industrial Dynamics. Forrester is thus the founder of the field of system dynamics – the study of nonlinear behavior of complex systems over time. And cities are indeed complex systems…mostly due to the complexities of human behavior.
Forrester’s book was groundbreaking but also controversial. To validate the theory with an actual city, the U.S. Department of Housing and Urban Development (HUD) – which was also five years old at the time – sponsored a two year study. Four cities were chosen as cites in 1971 and they were all within a 40 mile radius of MIT. The first experimental city was Lowell, Massachusetts.
Louis Alfeld was the Director of the program. In 1994 – on the 25th anniversary of the publishing of Urban Dynamics – he reflected on the execution of the experiments and the lack of progress since. The effect of human behavior on complex systems is apparent even in the administration of the study. HUD assigned the harshest critics of the theory to be on the committee which complicated things from the start. Alfeld recalls,
“Although we attempted to engage the committee in a constructive dialogue concerning the model’s utility, the members had neither the time nor the inclination to study system dynamics. Criticisms concerning data and validation techniques displaced issues of system structure and user needs. Neither side understood the other’s point of view.”2
Because HUD committee members were trained in traditional economics and only trusted well-cited existing academic literature, they continually dismissed and rejected every premise of systems theory. It prompted Forrester himself to respond with these words,
“It is unfortunate that you have not found it possible to spend more time with us in order to better understand system dynamics and its application to the dynamic modeling of social systems. Many of the issues you raise seem to rest on assumptions that reflect practices in other kinds of modeling but which do not apply in the same way to system dynamics models. In fact, the strength of system dynamics arises from these differences.”3
In contrast to HUD’s skepticism, Forrester and Alfeld found the leadership at Lowell to be more open to these theories. Their city was in decay after falling ungracefully from a century of manufacturing success. Their buildings were crumbling and the city faced a persistent 12% unemployment rate. They were eager to try something new.
One of the foundations of urban dynamics centers on available land as a resource. Defined as a nonlinear function, it says the rate of construction is constrained by the amount of land on which to build. New cities start out with abundant land, but being the first company to build comes with risk. Will employees follow? Will the resources be available to turn a profit? But one building can attract more buildings and if all goes well the competition for good land increases and growth, fueled by demand, explodes. This in turn inflates the price of attractive available land. Inflation then slows growth until all the land is consumed and new construction halts. Over time these buildings decay, businesses fold, and the city begins to decline economically and socially as people and customers leave. The only way a city constrained by space can maintain equilibrium in this closed system is to tear down old buildings and build anew on existing land. This was the fate Lowell faced.
The city government enacted policies that reflected the theory of urban dynamics. They created incentives to local companies to remodel existing buildings and expand business. They took steps to curb further deterioration of existing housing left vacant by affluent residents who fled. This in turn made more housing accessible to lower income residents who rushed the city like a flood. These policies resulted in strict codes that forced a refurbishing and reinvestment in the city.
After two years Lowell showed signs of improving. Alfeld and the city were encouraged to keep experimenting. But HUD had encouraged the city to set the parameters of the model to mimic metrics from Lowell’s previous historic economic boom the century prior. Falling short of these expectations in two years, the committee was not convinced Forrester’s theory of urban dynamics resulted in sufficient enough of an improvement to continue.
Hard quantitative evidence these traditional economists demanded was indeed lacking, in part due to HUD’s inability to operate a mainframe. But in the end the committee seemed more interested in the numbers than in the positive qualitative effects evident in the city and its residents. As Alfeld grimly summarizes,
“The interface gap between model and critic contributed to the communication gap. In the final accounting, neither our success in Lowell nor our outpouring of reports and papers could bridge that gap. HUD judged that we had nothing to offer and urban dynamics dropped out of academic sight, its potential contribution to resolving America’s urban crisis ignored for the past quarter-century.”4
THE AGING ARIAN AGRARIAN
The Des Moines Metropolitan Area is not space constrained like Lowell, Massachusetts. And while the city of Des Moines has reinvigorated the downtown area, the seemingly unlimited surrounding land availability and patterns of sprawl reveal no intention to contain the sprawl, protect farmland (or natural grassland) and reinvest in what is already built. This will likely lead to each inner concentric ring of the donut hole to age and decline just as the city of Des Moines did. This will create a larger donut hole in the center as the outer perimeter of the donut continues to encroach on more and more prime farmland. Land that is owned by dying farmers.
One Iowa State University study revealed that “in 2017, over half the farmland (60 percent) in Iowa was owned by people over the age of 65. This was five percentage points higher than in 2007, and twice the level in 1982. In addition, farmland owners who were 75 years or older owned a record 35 percent of all acres in Iowa as of July 2017.”5
A 2021 study showed that “Iowa farmland owners are older than the general population. On average, the full-time and part-time farmers in [the] study were 62 years old. The retired farmers were, on average, 77.7 years old, and the non-farmer owners were 68.7 years old.” Non-farmers can include surviving spouses who don’t farm or off-farm heirs to the land. Also, “Of the farmland [] analyzed, 29.5% was owned by full-time farmers, 12.9% by parttime farmers, 22.7% by retired farmers, and 34.9% by non-farming owners.”6 With 60% of farmland owned by soon-to-be retirees and a sizable portion of 35% owned by heirs who’d rather have the money than to farm, what does this say about the future of farming in Iowa?
Iowa, and the country, has a farming succession problem. One study suggests that lack of knowledge transfer and co-creation of crop yields will be one of the biggest challenges facing the foodscape of the Midwest. But when it comes to succession strategies, the Iowa farmers in this study,
“were on average motivated strongly by social factors—e.g., desires to maintain agrarian cultures, rural communities, and family farms. (It is worth mentioning that these sentiments could be colored by the fact that these were also established growers—e.g., those privileged by policies like the Farm Bill—who were well capitalized and could afford to focus on non-economic factors.)”7
That’s not to say these farmers haven’t suffered economic hardship. And the economics of farming are complicated and messy. But this researcher found new farmers to more interested in the sustainability of the land and in farming than those who inherited a farm. Those farmers are now looking to retire and their children typically aren’t interested in farming. The author continues,
“Intergenerational knowledge transfer, from one generation to the next (though not necessarily within the same family), is a critical element in the creation of foodscapes populated with farms of all scales and commodity profiles and by farmers from diverse socio-economic backgrounds, including farm/nonfarm backgrounds, genders, sexual orientations, ethnicities, and religions.”8
This requires building communities that welcome this kind of diversity, which most do not. People from Myanmar is one of Des Moines fastest growing minority groups, but an ethnic minority advocacy group says,
“It's very challenging. I talk to my friends on the coasts. People (without family here) don't want to move to Iowa…In Iowa, we don't have investments and resources for immigrants, for refugee-led, community-based groups."
There are groups trying to help. For example, The Practical Farmers of Iowa have been working since 1985 to “equip farmers to build resilient farms and communities.” Also, there’s the Women Food and Agriculture Network whose “mission is to engage women in building an ecological and just food and agricultural system through individual and community power.” Many of those fast growing small farms in Iowa fit the profile of these groups. It’s an encouraging sign for the health and diversity of small scale farming in Iowa.
But there are only 600 minority farmers in Iowa. What are the odds these aging white male farmers of selling their property to a Myanmar farmer or an ambitious woman graduate from the Iowa State College of Agriculture? How likely is an aging retiree willing teach a black family from the south with farming experience how to grow soybeans in Iowa? If a farmer isn’t willing to co-create or sell their farm to a first generation farmer who isn’t a Christian white heterosexual male who’s interested in perpetuating the ‘old-boys club’, then they’ll likely just sell it to another aging white male farmer like them. This will further consolidate Iowa farmland that will likely end up in a trust fund for their heirs. Many of whom will wait for the expanding urban gray blobs to reach their land and then they’ll likely cash in on a $2,000,000 offer from a real estate developer.
And with 81% of Iowa being white, with an estimated 90% of them living in the suburban fringes away from what little diversity there is in Des Moines, you can bet the person buying that newly built white home with granite countertops will be as white as their kitchen cabinets. At the same time, it’s great these families found a good home. I grew up on fertile Iowa soil as part of Norwalk’s first round of sprawl and it benefitted me.
.png)
Either way at least the seeds got in the ground on time. They can eat that yummy corn on the cob this summer with their hamburger made from Iowa beef. It will all take place on a grassy lawn that once grew the corn they’ll be eating…or the corn that fed the cow in their burger. Come to think of it, maybe their corn will come from California too…and the hamburger.
Mapping annual urban dynamics (1985–2015) using time series of Landsat data. Xuecao Lia, Yuyu Zhoua, Zhengyuan Zhub, Lu Liangc , Bailang Yud, Wenting Cao. Remote Sensing of Environment Journal. 2018.
Urban dynamics-The first fifty years. Louis Edward Alfeld. System Dynamics Review. 1995.
Ibid.
Ibid.
Iowa Farmland Ownership and Tenure Survey 1982–2017: A Thirty-five Year Perspective. Wendong Zhang, Alejandro Plastina, and Wendiam Sawadgo. Iowa State University. 2018.
The Tax Implications of the American Families Plan on Iowa Farmland Owners. Kristine Tidgren. Iowa State University. 2021.
Lands changing hands: Experiences of succession and farm (knowledge) acquisition among first-generation, multigenerational, and aspiring farmers. Michael Carolan. Colorado State University. 2018.
Ibid.


